Weekend Values – August 15, 2010

Posted August 15th, 2010. Filed under Investing Links

One of the best sources of ideas for possible investments is other value investors. If nothing else, an initial writeup and investment thesis is a good starting point for further research.

Here are a few potentially undervalued stocks picks from this past week:

HAWK

Guest post: Seahawk Drilling Inc (NASDAQ:HAWK) and the Hacienda – Greenbackd has written several nice write-ups for HAWK (See here and here), an undervalued driller that is trading for less than the price of its assets. The stock was a spinoff from Pride International in 2009.

In this guest post, a tax lawyer explains some of the circumstances surrounding Seahawk’s tax disputes with the Mexican authorities. Tax situations can be a key catalyst for unlocking value in other investments, which makes the post an interesting read.

QXM

Qiao Xing Mobile Communication (NYSE: QXM)‎: Waiting for A Catalyst – QXM is a stock that has shown up on NCAV and NNWC screens for quite some time. I’ve looked at the stock several times myself, but never pulled the trigger.

ValueHuntr does a nice job of breaking down a range of liquidation values. If an activist investor or catalyst presents itself, the stock has the potential for excellent returns.

NOOF & TIXC

Is Mr. Market being too harsh on these stocks? – ShadowStock is a blog that always churns out a number of opportunities in the smallest of small stocks – nanocaps are a major focus. TIXC and NOOF are both detailed, with several other possible value plays.

NOOF is a stock is a current holding at Value Uncovered (see my posts on NOOF here and here). Insiders have started to aggressively buyback shares over the past week after the stock hit new lows, a good sign for prospects going forward.

YNGFF

Investment Analysis: Yukon Nevada Gold (YNGFF.PK) – This was actually a post from a week and a half ago over at Above Average Odds but I just came across it, and it was too interesting to pass up.

YNG is a turnaround story currently trading on the Pink Sheets. The gold miner has a long string of catalysts for the second half of 2010 and into 2011, and some analysts seem to be pick up the story as well.

Disclosure

Long NOOF

Advant-E Corp (ADVC) is a tiny software company that has flown under the radar during 2010 despite outstanding financial performance and near term catalysts in the form of a special dividend.

The stock remains significantly undervalued at current prices.

Financial Highlights

ADVC reported a 6% improvement in second quarter revenues compared to the second quarter of 2009.

Net income also jumped by 28% in the quarter, due to a pickup in sales on the Merkur side of the business, along with strong cost controls across the board.

Merkur Group – Enterprise Software

The traditional software side of the business has struggled throughout the recession, posting revenue declines over the past several quarters. Impressively, the company has managed to squeak out a profit over that time period due to lower commission rates and cost controls.

The latest release shows the first glimpses of a turnaround for Merkur.

Quarterly revenues increased 2% from the same period last year, and 54% compared to the first quarter of 2010. This is an encouraging sign that ADVC’s customers are returning after pushing off purchases throughout 2008 and 2009.

Edict Systems – SaaS (Internet-Based)

The steady growth in the Edict Systems business has been amazing, considering the economic climate over the past 2-3 years.

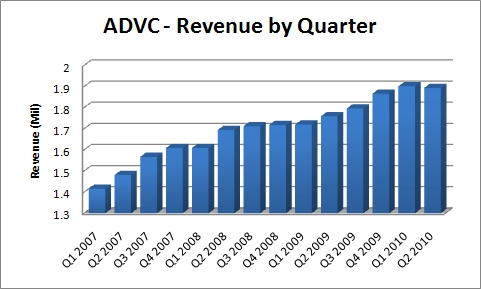
Going back the past 14 quarters, this is the first quarter where the company didn’t produce sequential quarterly revenue increases:

ADVC - Quarterly Revenue

The company has no debt and an unused $1.5m credit line. ROE and CROIC come in at 21.6% and 25.6% respectively, both outstanding.

Overall, the company reported record quarterly income, the 28th consecutive profitable quarter, and is on track for the highest FCF year in company history.

Special Dividend

In November 2009, the board of directors voted to approve a 10-for-1 stock split and corresponding special dividend of $0.03 per share, a 21% ROI based on the stock’s closing price at announcement.

The dividend would be paid in 3 quarterly installments due in December 2009, June 2010, and December 2010.

Although I missed out on the Dec ’09 dividend, $0.02 per share in dividends during the course of 2010 is an 11% return at current prices.

Valuation

Even with the near term catalyst and impressive financials, the stock is trading well below its normal multiples in a number of categories:

Current vs 5 yr Averages

P/E – 9.7 vs 13.7

P/B – 3.0 vs 3.8

P/Sales – 1.4 vs 1.9

Based on both DCF and EPV valuation methodology, ADVC should be trading closer to $0.30, providing substantial upside (and dividend) at its current price.

Conclusion

So, we have a stock that is paying a cash dividend, setting record net income & cash flow levels, increasing revenues each quarter during the worst economic downturn since the Great Depression, and yet is trading well below its 5 year averages?

Seems cheap to me – what do you think?

Disclosure

Long ADVC

In recent posts, I’ve written about the disappearing abnormal returns for additions to the S&P Index and the significant outperformance of S&P deletions after the effective date.

To finish off the series, I’d like to catch up with several recent developments around these trading strategies and examine if the same abnormalities would hold for other indexes as well (namely the Russell 2000 Index).

But first, I’d like to point out some changes related to the S&P indexes…

S&P Discontinues Announcements

Standard & Poors posts news and announcements regarding the various indexes on their website.

Each announcement can be saved as a .pdf file, but the website does not provide an RSS feed for staying up to date.

During the research for my previous posts, I was able to sign up for S&P’s email list in order to receive timely announcements regarding additions and deletions, without having to check the website each day.

Sadly, I received an email on August 3rd announcing that Standard & Poors will be discontinuing their email list:

“S&P is implementing a new policy that will affect email alert communications in relation to index announcements and other index-related matters. Effective August 13, 2010, S&P will provide email alert communications only to subscribers.”

Unfortunately, subscription is not cheap.

Recent Additions

Since my original post, Standard & Poors has announced several changes to the indexes.

On July 8, S&P announced that ACE would replace MIL in the S&P 500 index on July 14.

Results:

  • Price on AD + 1 – $54.69
  • Price on ED – $55.88
  • Outperformance – 0.81%

In addition, two other stocks were added to the S&P Smallcap 600 index on July 8 (ODSY & SXE) for those who would like to continue following this strategy.

Recent Deletions

On June 23, S&P announced that MAG would be replaced by FSS in the S&P Smallcap 600 index due to market cap considerations.

Results:

  • Price on ED – $0.92
  • Price on ED +20 – $1.09
  • Outperformance – 12.22%

The deletions strategy continues to outperform.

Russell Index

reader comment asked whether the trading strategies detailed in my original posts would also apply to the Russell 2000 index.

While the S&P 500 index is widely used as the “benchmark” for large-cap mutual funds, many small-cap funds compare their returns to the Russell 2000, the bottom 2000 stocks in the Russell 3000 Index.

Russell Reconstitution

As opposed to the S&P index – where stocks are picked subjectively by committee on an as-needed basis throughout the year – stocks are added to the Russell Index using strict rules based on market capitalization.

Rather than replacing stocks throughout the year, the Russell Index is rebalanced once a year during the month of June – an event known as reconstitution – with a preliminary list of additions and deletions announced two weeks in advance.

In 2010, a preliminary list of stocks was announced on June 11, with an official reconstitution date of June 25.

Just like the S&P effect, index funds following the Russell 2000 are required to closely match the index returns – meaning managers must buy and sell indiscriminately around the reconstitution date.

Returns

Academic studies have shown stocks added or deleted to the Russell 2000 show statistically significant returns during the reconstitution period.

In 2010, there were 333 additions and 219 deletions. I calculated average returns below.

Results:

  • Additions: 1.23%
  • Deletions: -1.90%

This compares to a loss of -0.36% to the underlying index.

Conclusion

Based on these results, there seems to be an opportunity for investors to profit from this annual re-balancing.

However, there are certainly challenges:

  • The sheer volume of changes could make a profitable trading strategy hard to implement.
  • Differences between the preliminary and final list could leave investors holding stocks that did not make the final cut.
  • Several changes to the reconstitution method – including market cap banding and adding IPO stocks on a quarterly basis – have decreased the abnormal returns.

Even with these considerations, there is evidence that the Russell 2000, just like the S&P indexes, experiences an index effect that drags on investment returns.

One study (co-authored by Vijay Singal, the author and inspiration for my previous posts) found that the Russell 2000:

“underperformed other small-cap indexes by more than 3 percentage points a year in the 1995-2002 period, even though comparable indexes did not entail more risk.”

Disclosure

No position in any of these stock at the time of this writing.