TNRK - Financial Overview

Company Overview

TNRK designs, assembles, and sells batteries to a variety of industrial markets. The company purchases batteries from major and well-known manufactures such as Energizer or Sanyo, assembles the individual items into battery packs, and then maintains the inventory for sale and distribution.

The batteries are sold to OEM manufacturers, hotels/resorts, military, aerospace, and electrical wholesalers – TNRK even designs and assembles custom battery packs to customers’ specifications.

The company maintains two major distributions centers in Florida and California, and runs the websites www.batterystore.com and www.tnrbatteries.com.

Management & Ownership Structure

TNRK is family-held, with management and insiders holding 38% of the company. Wayne Thaw, the company’s Chairman of the Board and CEO, has been involved with the company since inception and held a management position since 1987.

His brother, Mitchell Thaw, serves on the board of directors and has an impressive Wall Street background, where he specialized in equity options and structured products, including running a $900M capital structure arbitrage fund.

The father, Norman Thaw, is a former director and still 17% of the company, giving the Thaw family effective control over the business.

Paul Sonkin of Hummingbird Capital Management, a micro-cap and nano-cap focused value investing fund, owns just over 65k shares, or 21% of the company, purchased in the 2007-2009 time period.

Financial Overview

TNRK is profitable but growing its top-line at 1.47% over the past ten years, not exactly an exciting growth rate and lagging inflation.

While the overall prospects for the battery industry remain bright (as society becomes more and more electronic), TNRK will continue to face significant challenges in growing its core business. In the company’s own words:

Battery wholesale distributors face increased competition as offshore (specifically China) and U.S. manufacturers continue to sell directly into the marketplace alongside an increasing number of web-based operations and expanding local battery franchises. Competitors continue to price their products aggressively which has a direct impact on the Company’s overall sales and gross margins.

Revenues peaked in 2006 at $9.72m, only to fall to a low of $8.73m in 2009. The company did show signs of improvement in 2010 and 2011, but sales seem to have stagnated around $9m.

Gross margins have remained steady in a range of 30-32% over the past five years . However, despite the lower sales, SG&A expenses increased from 18-19% of revenues to 24% in 2010 before falling to 22.7% in the TTM period.

Much of the recent decrease in SG&A can be attributed to a revision of the rental agreement for the company’s HQ, payable to a holding company owned by the CEO Wayne Thaw (the conflict of interest was disclosed in the annual report).

The lease agreement was renewed in 2007 at the height of the bubble, which made the rent expense seem high – the revised agreement provides a 27% lower rent payment to reflect depressed market conditions.

Operating margins have declined for the past five years to 6.3%, but seem to be leveling off around the 6% mark.

Despite the struggles in the industry outlook, the company has remained profitable in each of the past ten years.

Investment Thesis

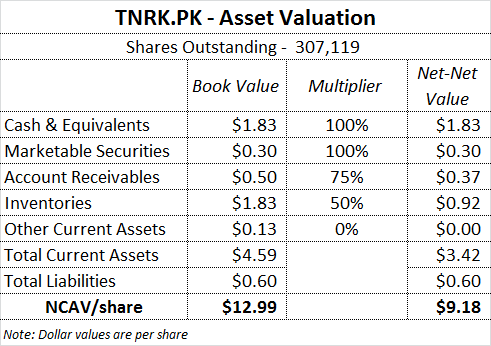
1. TNRK is a net-net stock and therefore extremely cheap on an asset basis – P/B is 0.68x, and at current prices, TNRK trades for less the value of the current assets on the balance sheet after subtracting all liabilities: 

TNRK - Asset Valuation

Even after taking downward adjustments for the A/R and inventory line items, adjusted NCAV (or liquidation value) is $9.18/share.

2. TNRK’s business fundamentals are actually decent – Many net-net stocks are in very ugly businesses with terrible capital allocation, high capex requirements, and inconsistent profits. While TNRK’s industry has its challenges, the core business requires little in the way of investment.

The company is overcapitalized (so ROE is low) but looking at the operating business itself reveals a decent fundamental picture: 

TNRK - ROIC Overview

ROIC has fallen from the 30-40% range but seems to have stabilized around 17-18%, which is very good for a net-net stock (remember, the market is basically assigning zero value to the operating business).

While TNRK isn’t a great business, it isn’t a terrible one either – management does not appear to be destroying value by keeping the lights on.

3. Management is paying out surplus cash to shareholders – Over the past several years, excess cash has been returned to shareholders.

Since 2006, TNRK has paid out $5.5m in three large special dividends, or roughly $18/share. 

Too many companies with surplus cash balances try to diversify into other business lines, or (even worse), blow the cash on a bad acquisition.

These payments should continue to be a catalyst for unlocking value for existing shareholders, even if business conditions do not dramatically improve.

Return Scenarios

Despite the negative trends, TNRK continues to throw off a ton of cash.

TTM FCF is $640k, which equates to a 23% FCF yield – if you choose to calculate FCF yield as FCF/EV, the result is an absurd 97% yield.

At these prices, the market is not only assigning zero value to the company’s inventory, it is assigning zero value to a profitable operating business that should generate $250k-$500k in annual cash flow over the next several years.

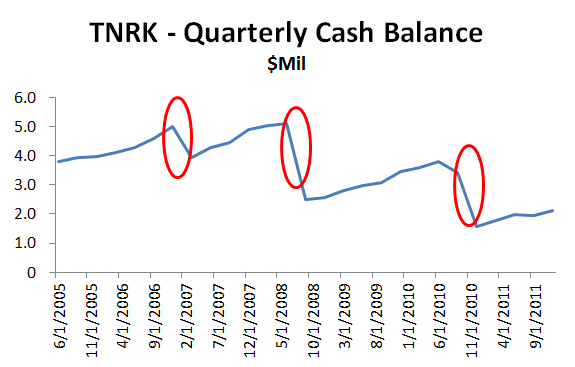
Consider the picture of TNRK’s cash balance over the past few years: 

TNRK - Quarterly Cash Balances

A nice pattern emerges: A run-up of excess cash over several quarters, then a special dividend to shareholders.

Keeping this pattern in mind, let’s assume that TNRK will pay out a $1m dividend at the end of each year that the cash balance reaches $2.5m.

I also simplified the calculations so that the annual change in cash = net income, as FCF has closely tracked income over the past five years.

Here’s how the scenario might unfold:

Bull Case

TNRK - Return Scenarios - Bull

In this case, two separate $1m dividends are paid over the next five years, returning ~70% of the purchase price – and leaving a cost basis of $700k for a profitable business with $1.5m in cash in the bank.

Bear Case

TNRK - Return Scenarios - Bear

Even under a more extreme scenario where EPS falls rapidly over the next five years, the company still pays a $1m dividend, returning 36% of the purchase price – and leaving a breakeven business with $1.76m in cash, few liabilities, and a several million dollars in additional current assets that could be liquidated.

Risks / Negatives

Tiny illiquid stock – TNRK often seems to trade by appointment. Many days or weeks can go by without a single trade, and even small blocks can cause double-digit price swings.

Management compensation is high – The top three officers took down $550k in salary and bonus in 2011, which is a significant chunk for a company with $9m in revenue (it is even higher if you include the rent expense to the CEO’s holding company, although TNRK would have to rent the space from someone).

Material business decline and/or obsolescence – Theoretically, TNRK’s suppliers could choose a different distribution channel and cutoff TNRK. The latest report also mentions a potential supply disruption in China due to more stringent environmental standards for lead acid batteries. If sales fall and management is unable to cut costs, the business could decline at an even more rapid rate, potentially limiting dividend payments.

Conclusion

This is a relatively simple investment case, as TNRK trades below its liquidation value despite a history of profitably and no signs of radical disruptions in the business outlook.

Through the first six months of fiscal 2012, the business is showing small glimmers of a turnaround (or at least a stabilization), with ROE, ROA, Gross Margin, and Net Margin all up over the prior twelve months.

TNRK is part of my basket of net-net stocks. Going forward, either:

1. The business model is not obsolete and conditions improve. Management is able to rein in the cost structure. Earnings return near historic levels.

Result: TNRK’s share price goes higher on a more rational multiple of earnings. Shareholders benefit from share appreciation and dividends.

Or…

2. The business continues on a steady decline, and management is unable to reduce costs to compensate for lower sales.

Result: The business stockpiles cash flow for several years, pays out special dividends, and eventually liquidates or goes private.

Both options seem to offer attractive returns over the next several years with limited downside – therefore, I continue to hold TNRK as part of my basket of net-net stocks.

Disclosure

Long TNRK


As I’m now entering the fourth module of my 1st year in business school, I’m starting to get into some of my elective classes for investment management.

So far, it has been a lot of academic-focused lessons on efficient markets, betas, CAPM, and factor models…not exactly topics that mesh with trying to outperform the markets by picking undervalued stocks!

Even so, it has been helpful to understand the viewpoint of academic finance. Even if I do disagree with most of it, I can appreciate the process behind many of the studies.

In fact, the best part so far has been having access to massive amounts of quality financial data and academic research.

I thought I would include a few of the more interesting charts and graphs from the year so far.

Returns on Small vs. Big

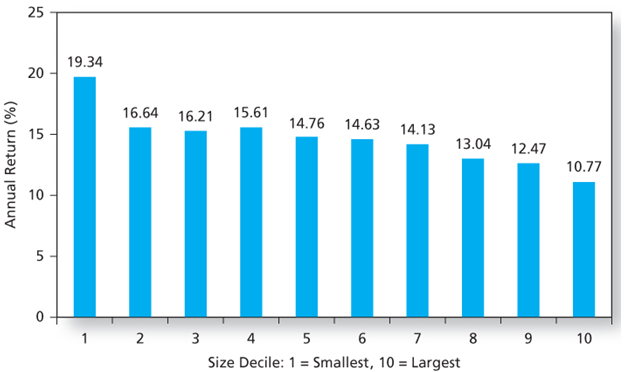
Academic Research - Returns by Market Capitalization Deciles

Source: Professor Ken French’s Data, 1926-2008

Confirmation that small stocks outperform larger ones (and validation for the small-cap focused nature of this blog).

Returns on Value vs. Growth

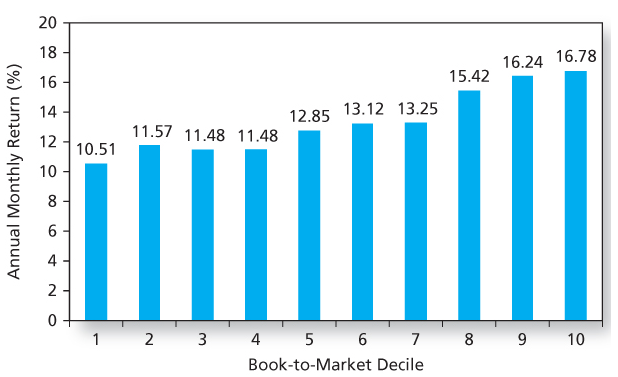
 Academic Research - Returns by Book-to-Market Deciles

Source: Professor Ken French’s Data, 1926-2008

And that value stocks outperform growth (high market-to-book = low P/B stocks):

Returns by Liquidity

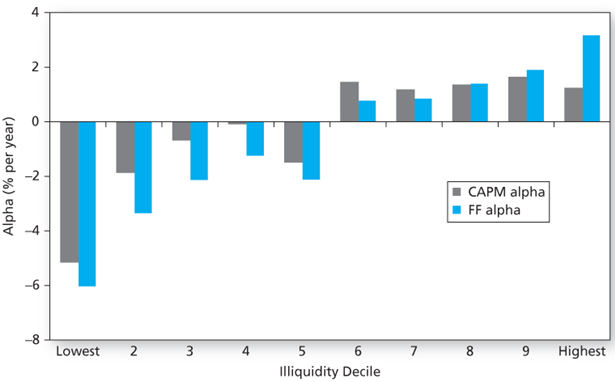
Academic Research - Illiquidity Premiums

Source: J. Liew and M. Vassalou, “Can Book-to-Market, Size and Momentum Be Risk Factors That Predict Economic Growth?”

Illiquidity can also be a factor in producing above-average returns. This chart shows the alpha generated by stocks across the liquidity range, above and beyond what is predicted by CAPM and the Fama-French 3-factor model.

Whether or not CAPM or the FF-model does a good job of predicting returns is another debate (they really don’t).

However, if an investor is patient, a willingness to tie up capital for an extended period (hopefully in an undervalued security) could yield above-average results.

Risk Premiums 

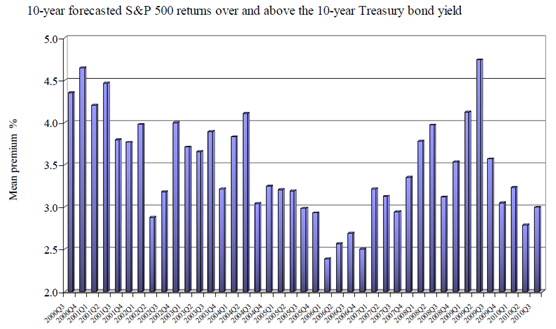
Academic Research - Forecasted Equity Risk Premiums

Source: John R. Graham & Campbell R. Harvey, “The Equity Risk Premium in 2010”

This chart is pulled from a forecast of CFOs on the equity risk premium used in cost of capital calculations.

An initial look at the graph shows that premiums are extremely volatile, which further weakens the validity of a CAPM model.

Interestingly, the reported risk premium hit a low in 2006/2007, just before the bubble popped (and when most stocks were overpriced).

On the other hand, CFOs demanded a much higher premium (and therefore thought future projects were riskier) in the early part of 2009, right when investors should have been buying.

Could a low risk premium be an indicator for poor stock market performance?

Earnings Surprises

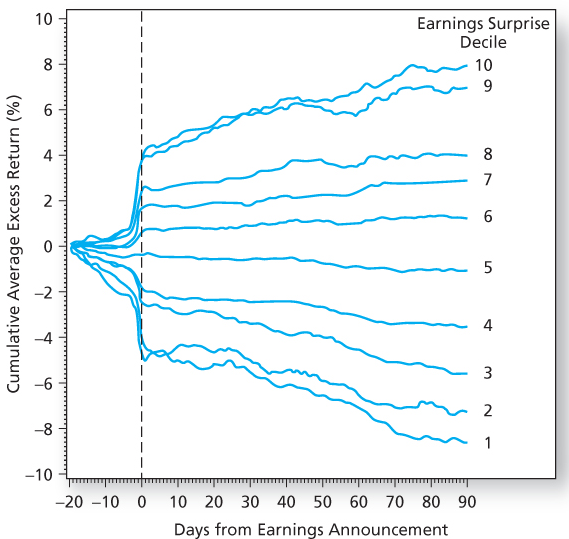
Academic Research - Earnings Surprises

Source: R.J. Rendleman Jr., C. P. Jones, and H. A. Latane, “Empirical Anomalies Based on Unexpected Earnings and the Importance of Risk Adjustments”

Many short-term focused hedge funds play an earnings game, and it turns out that there is some interesting effects, especially after large earnings surprises.

Efficient market proponents would argue that the market immediately adjusts to reflect the new earnings picture after an unexpected quarter, but studies have shown that earnings continue to drift for several months.

A possible takeaway: If a stock reports a surprisingly bad quarter which changes the fundamental thesis about the company, it’s better to sell right away vs. trying to time a better exit point in the future.

Activists

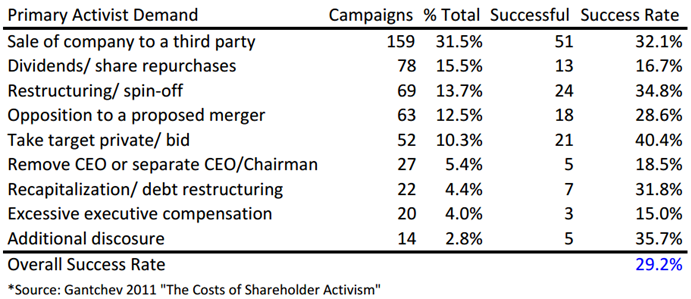
Academic Research - Activist Success Rates

Despite some very high-profile activist campaigns, only 29% actually succeed. It’s no surprise that lowering compensation and removing a management team have a below-average success rate.

As a microcap investor, going private transactions have been a key source of unlocking value, and the success rate probably reflects the fact that management is often on board in these transactions.

Asset Class Returns

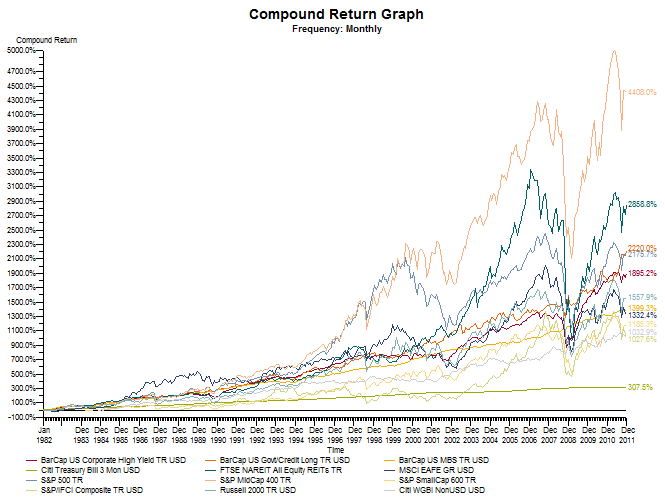
Academic Research - Asset Class Cumulative Monthly Returns

Access to high quality financial data allows a study of asset class returns over long time periods.

In this chart, the dip in 2008/2009 is clearly shown across almost every single asset class.

In fact, correlations between asset classes tend to increase significantly during high volatility periods, just at the time when diversification is supposed to provide the greatest benefits.

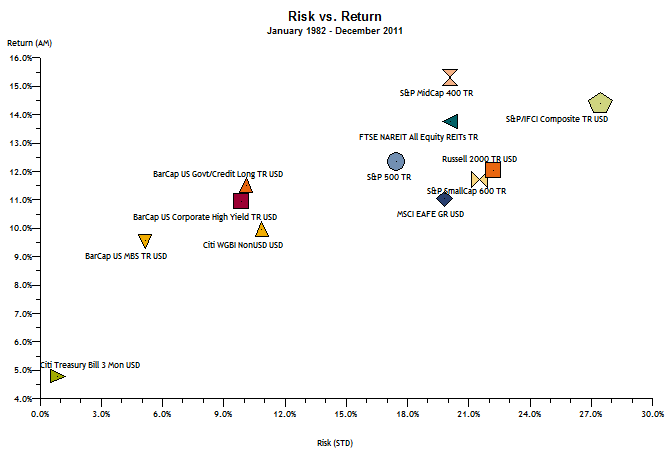
1982 – 2011

Academic Research - Asset Class Returns Past 20 Years

Look at the risk-reward of midcaps over the past 20 years…a possible underinvested asset class?

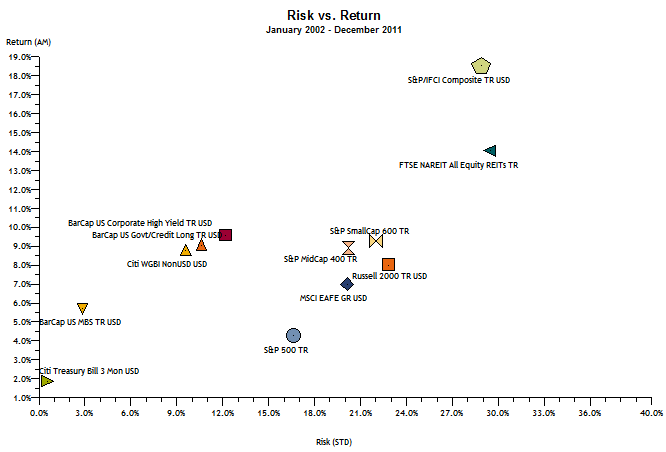
2002 – 2011

Academic Research - Asset Class Returns Past 10 Years

Over the past 10 years, stocks have performed poorly, as bonds returned nearly the same amount with much lower risk.

Final Thoughts

This post was a bit outside of my normal zone, so please let me know if you found this post interesting and/or worthwhile, and I’ll plan on collecting similar information going forward.

I’m also the getting involved in Kenan-Flagler’s student-run investment fund, which provides the opportunity to manage roughly $2m across a wide range of asset classes.

As the new Equities Manager, I’m responsible for the stock investments, so I’m looking forward to getting some practical experience over the next year – more stock pitches to follow!


Biloxi Marsh Lands (BLMC) is a pink sheets stock that owns 90,000 acres of wetlands/marshlands in SE Louisiana. The land is used for a variety of purposes including trapping leases and alligator tagging, but the key money maker is oil & gas.

Historically, BLMC rented out the land to exploration companies and collected a lease fee –in 2006, the company formed a subsidiary for active exploration, an aggressive shift in strategy that offers the potential for long-term investors.

Investment Thesis

1. Contrarian play on the bearish sentiment for natural gas – Natural gas prices have hit the lowest point in the past ten years, and the bears have been out in full force. Supply/demand economics argues that prices should eventually rise back to more normal levels (although it might not be until 2013 or later), and any boost will provide significant upside to BLMC.

2. New exploration subsidiary changes company’s strategy – Prior to 2006, BLMC was a passive land owner, leasing out land to other exploration companies in exchange for royalty income. The new B&L Exploration Company (B&L) is actively exploring on behalf of BLMC (with early signs of success).

3. Land provides downside protection – BLMC owns 90,000 acres in St. Bernard Parish in Louisiana, which is held on the books at significantly below market value. While the land is really only suitable for oil & gas drilling, the land should provide a backstop to the share price, limiting potential downside

4. Attractive dividend yield – The company has paid out $50m in dividends over the past ten years, with an average yield of 8.2%. Yields over the next 1-3 years will likely be lower given the recent price trend in natural gas, but any uptick in natural gas prices could result in a material increase.

Overview of the Natural Gas Industry

While I normally stay away from ‘macro’ plays, the success of this investment is so wrapped up in natural gas prices that additional detail is warranted.

A quick check through some of the latest news headlines shows the dynamic in natural gas right now:

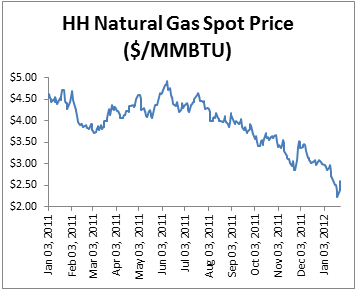
And looking at the recent price levels at the Henry Hub in Louisiana:

BLMC - Natural Gas Prices Henry Hub

So why such a drop?

  • A very mild winter in the United States has put a damper on gas demand for heating
  • Inventories are near record highs, creating a supply glut
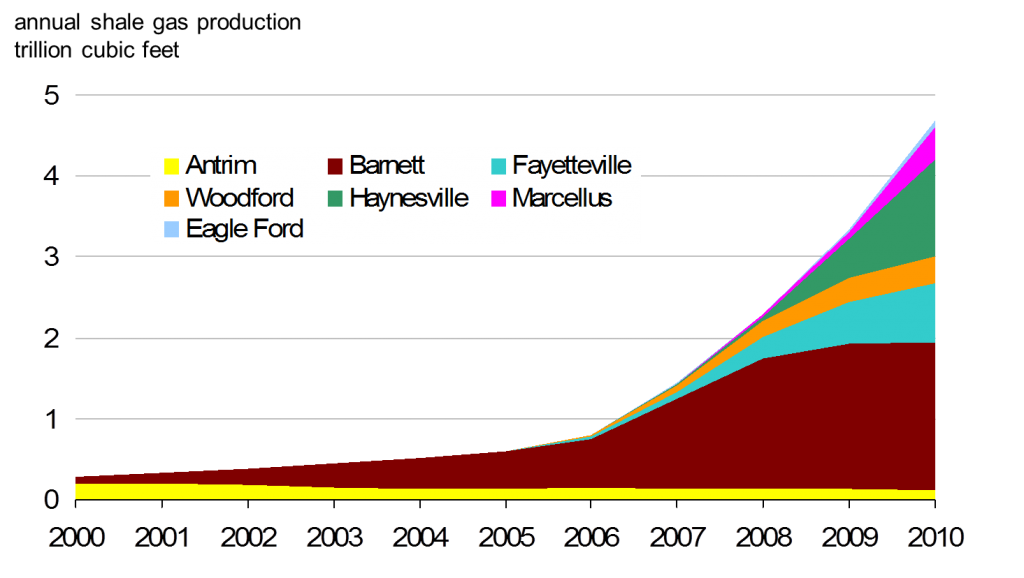
  • Incredible growth in natural gas from shale formations via innovative drilling techniques like hydraulic fracturing

The natural gas story is best told by pictures. Here is the growth in shale production: 

BLMC - Growth in Natural Gas Shale Production

Source: EIA, “The Long-term Outlook for Natural Gas”, Feb 2011

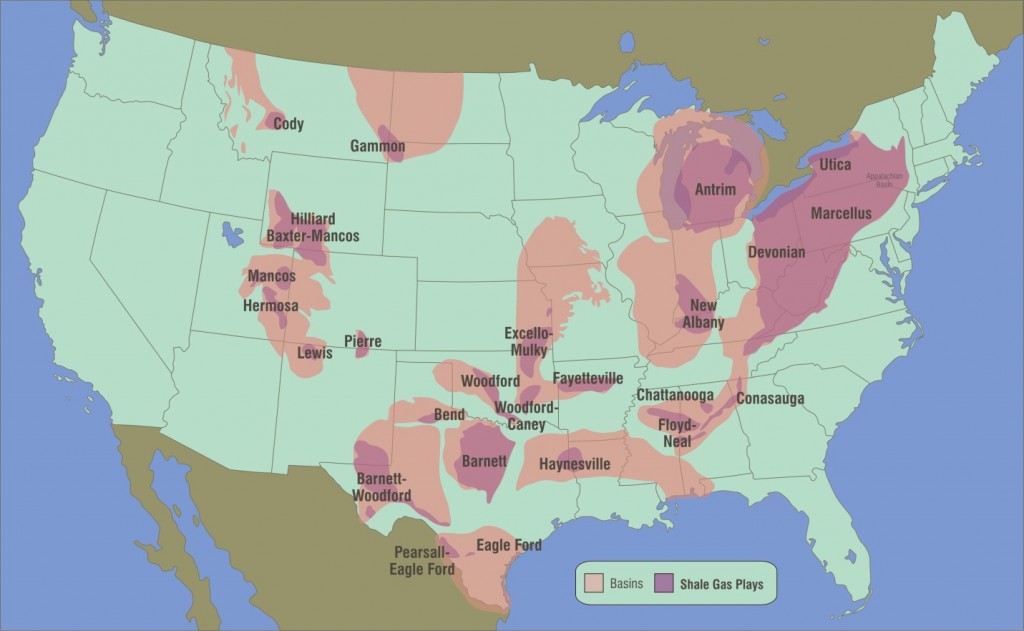
And a map of the major shale plays in the U.S.: 

BLMC - US Map of Shale Gas Formations

Source: EIA, “The Long-term Outlook for Natural Gas”, Feb 2011

However, this huge increase in production comes at a cost – literally – as these new shale plays are very expensive:

“Gas shale wells are expensive to drill and complete as well as the cost of the leases on which they are drilled. Even though initial gas production from shale wells is huge, the low price has depressed the amount of cash companies are receiving. As a result, producers are spending well in excess of their cash flows.”

In the rush to gobble up territory in these areas, exploration companies only have a few sources of cash:

1. Tapping Wall Street for debt & equity – While Wall Street can provide funding for far longer than is usually wise or prudent, there are signs that the other two sources are running out…

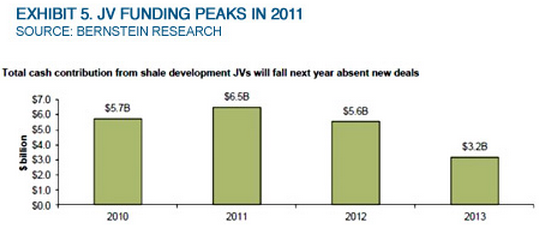
2. Investing in joint ventures – JV Investment are on the decline, with significant fall-offs in 2012 and 2013: 

BLMC - Natural Gas Joint Venture Investments

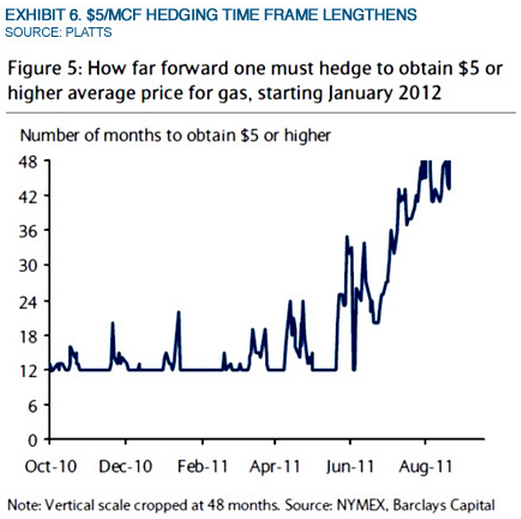
3. Hedging future production – Another alternative, where companies use the promise of cash flow from future production in exchange for funds now. However, the timeframe for receiving a decent rate for future production is lengthening dramatically: 

BLMC - Natural Gas Hedging Timeframe

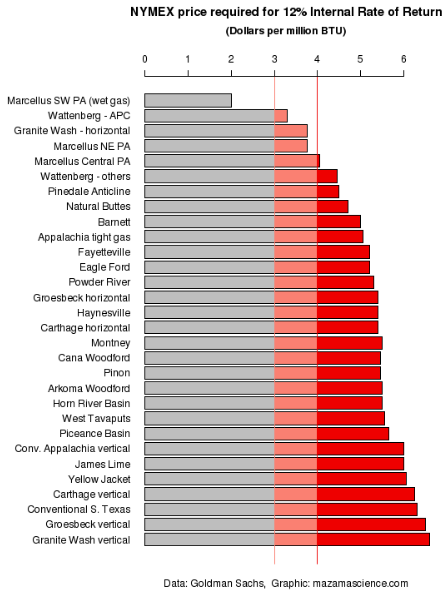
These low prices are bad news for shale gas, as many cannot earn satisfactory rates of return if gas stays below $3 or even $4 per MMBTU:

BLMC - Shale Gas Return Analysis

Despite some of these warning signs of a correction in natural gas, there is definitely a chance (likely a certainty), that natural gas prices will go lower in 2012 on the back of a mild winter and higher-than-normal gas inventory – maybe even breaking the $2.00 barrier.

However, supply/demand economics dictate that producers will cut production if prices stay low, as many high-cost producers will eventually go out of business if the trend continues.

Even some of the more well-known names are already cutting production – Chesapeake Cuts Natural-Gas Output as Prices Hit 10-Year Low.

But enough of the macro picture, let’s take a look at BLMC.

BLMC Financial Overview

BLMC’s revenues ebb and flow with the rise and fall of natural gas prices, and have ranged from a high of $21m in 2004 down to a low of $0.598m in 2008.

In the last few years, the bottom line has been boosted by several legal settlements with the state of Louisiana ($24.2m in 2009 and $5.2m in 2010, with most of the windfalls paid out via dividends).

While operating income from the traditional royalty base has been positive, the company has been funneling dollars into the B&L exploration subsidiary, which flows back to BLMC’s accounts through the “Income (loss) from Investment in partnership” line.

Therefore, investments in exploration within the subsidiary show up as a loss on BLMC’s income statement, which can cause an ugly bottom-line earnings number.

Through the nine months ended Sept 30, 2011, the company reported a net loss of $1.2m, compared to a gain of $0.788m in the same period last year.

The big difference was the subsidiary: partnership losses came in at $2.4m through the first nine months, although $1m of that loss was from depreciation & depletion expense, a non-cash charge.

Much of this cash outlay went towards drilling new oil & gas wells, so the future odds of recouping this investment is still uncertain – however, initial results show much promise.

So while the income statement isn’t exciting right now, BLMC’s balance sheet is extremely strong, with cash and cash equivalents of $3.3m as of September 2011.

In addition, the company has a diversified portfolio of marketable securities, mostly in large-cap stocks and bonds, with a market value of $11m.

Unlike many companies, Biloxi does include a detailed breakdown of the marketable securities portfolio in each annual filing.

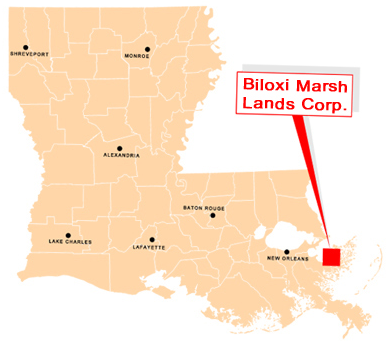
The Land 

BLMC - Land Map

Biloxi owns approx. 90,000 acres in Southeast Louisiana (see picture above). The company provides a detailed description of each plot, along with a property map highlighting the specific area.

Sadly, this is not land for development, as most of it is marshland and basically underwater – check out the scenic gallery here.

However, all of this land is being held on the books for $235k, or only $2.61/acre. This seems absurdly low, and reflects the fact that most of the land has been on the company’s books since the 1930s.

While the exact value of the land is open for disagreement, it HAS produced millions of cubic feet of natural gas, and would seem more valuable than $2.61/acre…

Could it be worth more than the current enterprise value of the entire company?

After talking with a Louisiana real estate expert, basic non-developed land goes for roughly $700-$1000 per acre. The inclusion of mineral rights (the ability to mine or drill for oil & gas and other minerals), adds roughly $100-$150/acre to a property’s value.

So even if we value the actual land at $0, and assign a value of $150 per acre for the rights only (on the high-end of the range, since it is a known gas-producing region), the total land value is $13.5m, compared to BLMC’s current EV of $12.5m.

Regardless of the true value, the land does provide a measure of downside protection, as management can always sell of parcels to meet funding requirements if the company was ever in dire straits.

Oil & Gas Properties

As of the latest quarterly press release, BLMC had ownership interest in 4 wells leased out to other exploration companies. In addition, the new B&L subsidiary has ownership interest in 6 wells, with an additional well being placed into production in the first quarter of 2012.

During the 2nd and 3rd quarter of 2011, B&L drilled four wells, with three out of four turning into successful commercial wells, a solid success rate (which also speaks to the quality of the management team).

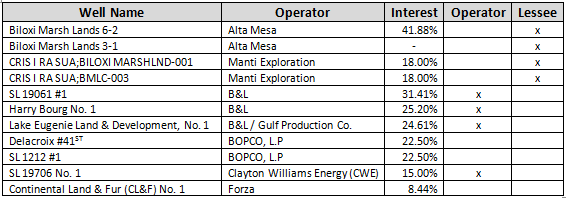
After digging through the Louisiana SONRIS database and the company’s historical press releases & filings, I was able to piece together a rough picture of BLMC’s wells:

BLMC - Well Information

Note: Ownership interests of BLX are approximate %, as it depends on split between A & B shares (not public info)

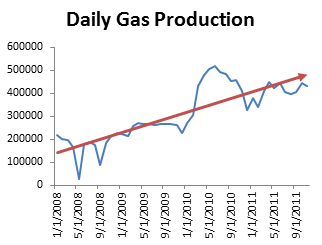
And a graph showing the daily production from the producing wells:

BLMC - Daily Gas Production

While there could be additional wells not captured in the chart above (a well that was included in a 2008 report but not in 2011 for example), it does show a nice trend in the daily production. Most of this additional capacity is from the B&L exploration subsidiary.

I want to highlight one well in particular, the company’s new Harry Bourg No. 1, which was discussed in the Q3 2011 press release.

Daily production in the Harry Bourg well has increased from 26,303 in September to 71,779 in November, a nice steady increase – it’s already the 2nd highest producing well for BLMC.

The company expects at least 2 more wells to be in production by the next report.

Reserve Picture

Each year, BLMC conducts a reserve study via an independent third party, with the results for 2010 included below: 

BLMC - Reserve Study

In addition to the above amount, the B&L subsidiary owns an additional 2.3 BCF of natural gas and 25 MBBL of oil of reserves – combined, total reserves owned by BLMC come out to 4.01 BCF of gas.

Over the past 7 years, proven reserves have varied, with a high of 5.793 BCF in 2004 and a low of 2.502BCF in 2006.

The latest quarterly reports shows that total reserves have increased slightly to 4.10BCF.

Interestingly, a quote from the latest study was included in the 2010 President’s report:

“The recently drilled LL&E No. 1 well located in Lapeyrouse field in Terrabone Parish, Louisiana has not yet been completed and no tests have been performed. The well encountered several pay zones, some of which are considered PDNP based on log and core data. Other zones encountered by the well are potentially productive and may have significant value.”

The company provides an explanation for including the quote (emphasis mine):

“is to make investors aware that there is a probability that the LL&E No. 1 well may have significant reserves that are not included…”

A revised study will be included in the upcoming annual report, but the management team seems rather conservative, and I think there is a good chance for a fairly significant reserve increase in 2012.

Valuation

Biloxi’s market cap is roughly $26m, with $3m in net cash.

In addition, the company also holds a large but liquid portfolio of marketable securities – mostly large cap stocks & bonds – worth another $11m at the time of the most recent quarterly report.

After subtracting out the cash and marketable securities, total enterprise value is only $12.5m.

BLMC has two different sources of earnings: the traditional fee-based revenue, plus income from the new exploration subsidiary.

In the 2011 shareholder letter, the company had 2.29 BCF of gas in a combination of developed producing & developed non-producing reserves (the “2P” metric) – on its fee-producing lands (i.e. the land it leases out to 3rd parties), with a PV10 of $7.559m.

Note: PV10 is a standard oil & gas metric which measures the present value of a company’s reserves, by taking future revenues, subtracting out direct costs, and discounted back at 10%.

Through its interests in B&L, BMLC owns an additional 1.72 BCF of gas (an additional 75% on top of the company’s outright reserves) which brings the total up to 4.01BCF.

So a back of the envelope calculation the combined PV-10 = $7.559m * (75% additional from B&L) = $13.22m, which is more than BLMC’s current enterprise value.

Remember, the PV10 number is estimating how much revenues will be thrown off by the company’s existing wells, and does not account for any further upside from new exploration.

The latest reserve study was from March of last year. While gas prices have cratered over the last 6 months, the new PV10 figure will be based on the 12-month average natural gas price through the end of 2011.

Although the recent headlines and price action has been brutal, the average month-end gas price was only down 10% YoY.

So being conservative and taking a 15% haircut on the PV10 number yields an adjusted PV10 of $11.2m going into 2012– once again compared to the total company EV of only $12.5m.

At these prices, the market is basically assigning zero value to:

  1. Any future appreciation in gas prices
  2. Any new lessors of the company’s land for drilling purposes
  3. Any future gas finds
  4. And over 90,000 acres of land

My take on management’s comments is that they intend to pay out dividends on all income from fee-producing lands (i.e. the $7.6m PV10 figure from above), but re-invest the subsidiary’s earnings back into more exploration.

While dividends over the next few years will likely be lower than previous years (no legal settlements and lower natural gas prices), the resulting yield should still be decent in a zero interest rate environment (4-5%?).

Finally, looking at the valuation on a historical perspective, BLMC is selling at an EV/Proved Reserves of 3x versus. 20x in 2007 – natural gas prices are obviously much lower now, but not 6.5x lower.

Conclusion

In summary, while investors sit around and collect a nice dividend yield, there are several upside scenarios:

  1. Gas prices improve, significantly boosting industry profits (2013?)
  2. B&L hits it big with a large new find (management has been savvy so far)
  3. Additional parties lease land on the property (in active discussions)
  4. BLMC markets its 3D seismic data (the Tuscaloosa project is rumored to have up to 5 TCF of gas, worth billions of dollars…wild speculation for now, but interesting nonetheless for a $25-30m company)

With all of these upside scenarios, I think BLMC is a safe bet for those who want exposure to an eventual upswing in natural gas prices.

I’ll finish with a quote from Jeremy Grantham, the Chief Investment Strategist of GMO on natural gas (emphasis mine):

“There are obviously powerful technical reasons depressing the price for natural gas. But it’s the premium fuel. It burns cleaner and better than any other hydrocarbon, and it sells at the lowest ratio of heat equivalent to oil in 50 years. It is about 15% of the energy-equivalent of oil price. It has sold at parity from time to time over the last 30 years. This is a dazzling opportunity.

Couldn’t have said it better myself…

Disclosure

Long BLMC