Company Overview
Mitani Group (8066:TYO) is a Japanese conglomerate that operates in segments from concrete to semiconductors and from bowling alleys to nursing homes. With roots going back to 1914, the company now manages almost 100 subsidiaries – an overview of the group structure is included on the website.
Many of these subsidiaries have operations that are hard to categorize, but the company is broadly organized into three main segments:
Information Systems – includes CATV, software development, and outsourced IT services
Energy / Life Support – includes housing equipment, gas stations, and wind power generation
Construction Materials – includes building materials, concrete products, and aluminum sales
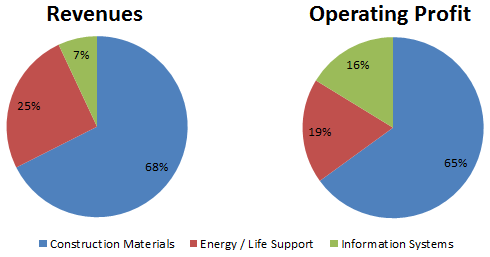
Of the three, the Construction Materials segment is the most important, accounting for almost 70% of sales and total profits:
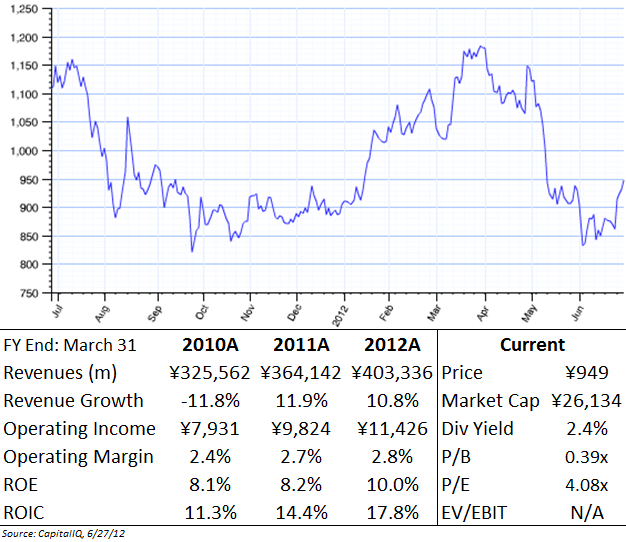
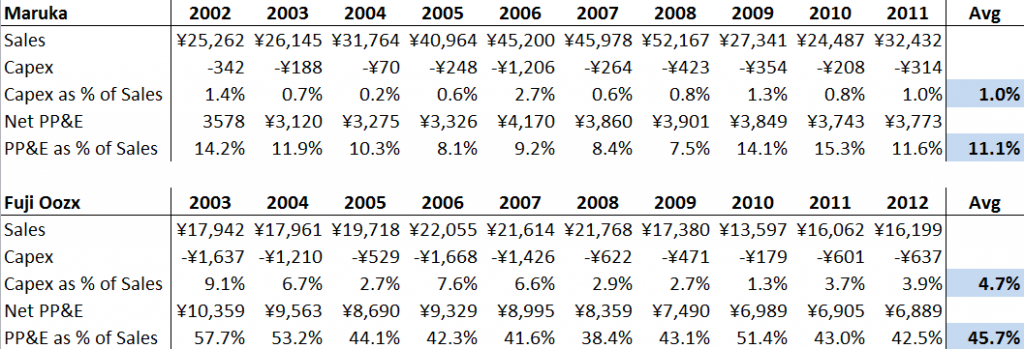
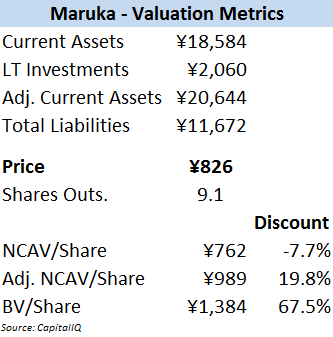
With a market cap of ¥26,134mm (~$330mm), Mitani is quite a bit larger than other Japanese net-nets like Maruka Machinery and Fuji Oozx.
Financial Overview
For the 2012 fiscal year, Mitani reported sales of ¥403,336mm, an 11% increase over the prior year and up 24% from recession lows. All three major business segments had positive growth, led by a 12% increase in the Energy & Life Support division.
Both operating and net income rose even faster, up 18% and 30% respectively, with EPS reaching a record of ¥232.
Over the past decade, revenues have grown 4.8%/year while SG&A costs climbed only 3.1%/year – these costs now consume 6% of revenue versus 8% ten years ago.
Unlike many other Japanese net-nets, Mitani does have some short and long-term debt on the balance sheet, totaling ¥9,919m, plus another ¥2,065m in retirement obligations.
However, this debt is offset by ¥45,136mm in cash and a very manageable debt-to-equity ratio of 16%.
Although Mitani has spent over ¥7,800mm on acquisitions over the past ten years, total goodwill and intangibles of ¥1,468mm is negligible when compared to ¥177,576mm in total assets.
FCF has averaged just over ¥5,000mm over the past ten years, for a FCF yield of almost 20%.
Investment Positives
Conglomerate structure helps dampen swings in economic cycle, which translates into smoother top and bottom line growth
Although Construction Materials makes up a significant portion of revenues and profits, the varied business lines among the operating subsidiaries insulate the company from economic swings.
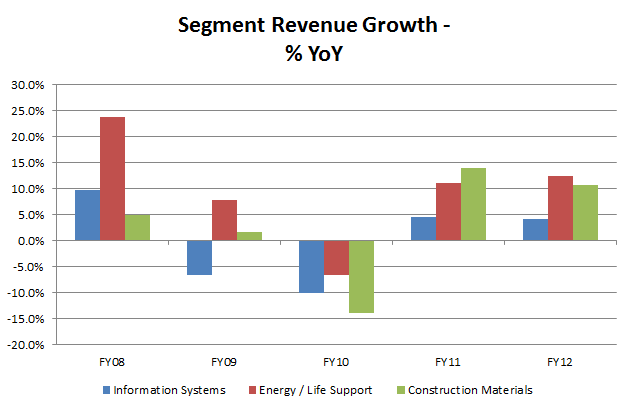
Here are YoY revenue growth rates for each business over the past five years:
Every business struggled in FY2010, but historically, drawdowns in one segment (such as in FY09) can be compensated by growth in other areas.
Compare Mitani’s negative swings to several other Japanese net-nets:
This consistency has translated into 4.8% annual revenue growth over the past ten years, a solid result considering the economic environment in Japan.
Due to operating margin increases and share repurchases, EPS grew at 27% annually over that same time period.
Positive industry dynamics will translate into continued demand for construction materials over the next 2-3 years, boosted by domestic rebuilding after the Japanese earthquake
Many construction materials and supply companies saw a sharp jump in stock price after the March 2011 Japanese earthquake on anticipations of a massive rebuilding effort.
Mitani’s stock price hit ¥1,405 per share in early May, up 67% in fewer than 30 days post-quake – other construction stocks showed similar increases.
However, the price jump reversed itself quickly, and Mitani’s stock price returned to pre-quake levels only six months later.
While the initial thesis was straightforward – earthquake/tsunami damage leads to greater requirements for building products like cement and concrete – investors seemed to misjudge how long the process would take.
The fact remains that the rebuilding in many of the hardest hit areas has only just begun, as this USNews report shows: “Before and After: One Year After the Japan Earthquake.”
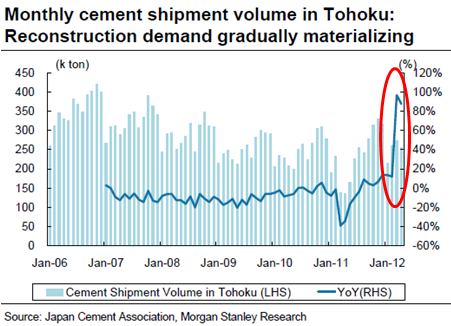
This is backed by cement shipments to those tsunami-affected prefectures (with cement demand being a good enough proxy for rebuilding efforts):
Notice how the demand spike did not occur until the first two quarters of 2012, almost a year after the quake.
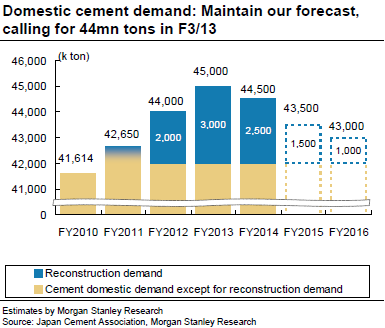
Analysts are expecting total cement demand to peak at 45b tons in FY2013 , with reconstruction demand providing a 3b ton boost:
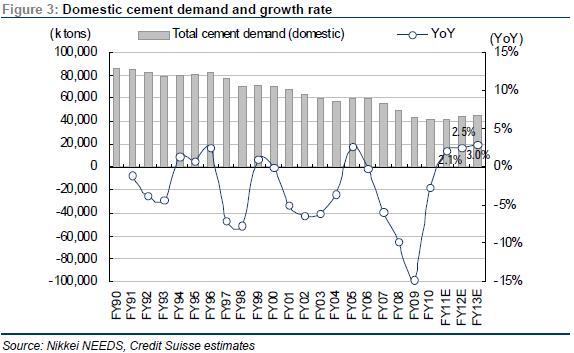
While growth in the cement industry has been modest, it reverses a two-decade trend of declining demand:
(Looking at the chart, FY2010 was a rough year: cement demand was half of the 1990 peak. That same year, total Japanese construction investment hit a low not seen since the late 1960s – truly staggering)
Mitani’s Construction Materials segment showed a 10% sales increase in FY2012, growth which should accelerate over the next 1-2 years.
History of conservative guidance softens impact of poor outlook in latest annual report
Despite the seemingly positive macro trends (at least in the construction industry), the FY2012 financial report provided a very conservative outlook for the coming year: sales up only 0.4%, operating income down 9.8%, and net income down 9.4%.
In the 30 days after the May 9th release of the annual report, the stock fell 18%.
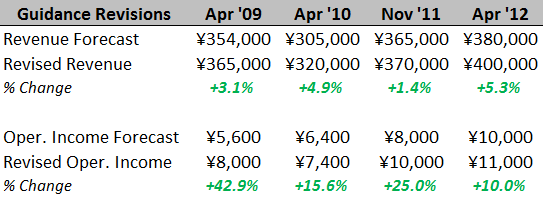
However, Mitani’s management has a history of conservative forecasts:
In each of the past three years, management has revised both the revenue and profit figures upwards – with the final result ending up even higher than the revised forecast.
While past history is no guarantee of future performance, the cautious outlook for FY2013 does not appear to be a major concern.
Availability of English-language financial statements
Not to be overlooked. While the raw financial numbers can be found in CapIQ or Bloomberg, Mitani publishes translated financial statements online.
This prevents translations mistakes (Google Translate struggles with Japanese. Trust me, I’ve spent hours trying to make sense of reports), and provides important information.
For example, Mitani clearly shows that ¥5,110mm of its long-term investments are Investment Securities.
While Mitani’s translated reports do not include financial notes or management commentary, even the provided info is lacking in many other Japanese microcaps.
Investment Negatives
Conglomerate structure – reduces chances of acquisition by competing firm, which is a key source of unlocking value in many microcaps.
Conglomerate discount – Markets often price conglomerates at discount to comparable pure-play companies (although discounting to zero seems a bit extreme).
Domestic-based – Mitani is highly dependent on the economic and political environment in Japan. Much has been written about the Japanese situation, with passionate arguments on either side. Readers can make their own judgments on the macro risks.
Currency risk – Many investors are betting on a weakening of the Japanese yen, which would reduce the holding period return when closing out a position and converting proceeds back to USD. Even with possible currency losses, the margin of safety with Japanese net-nets is huge – here are some interesting views on the yen and currency hedging (here and here).
Valuation
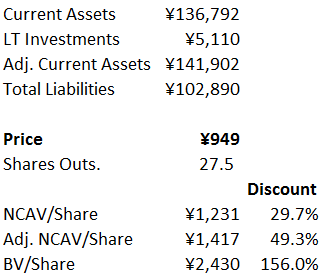
As with the other Japanese stocks I’ve invested in, Mitani is a traditional Graham net-net stock selling for less than NCAV:
The company’s enterprise value is negative -¥1,222m, meaning that the market thinks that Mitani’s collection of 100+ subsidiaries is worth less than zero.
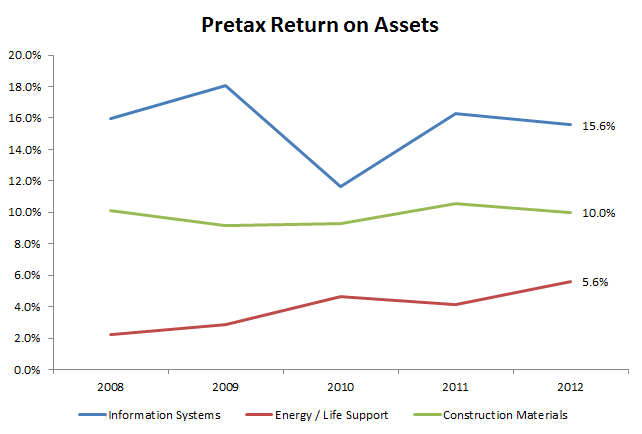
However, the Information Systems and Construction Materials segments are actually good businesses, with double digit pre-tax return on assets[1. Pretax ROA calculated as segment operating profit ÷ total segment assets, without adjustment for inter-segment sales or corporate-level assets.].
Even the Energy & Life Support segment has shown steady improvement:
Over the past decade, Mitani’s ROE has averaged 8.4%. Since FY2008 (right through a global recession) average ROE actually improved to 8.7% – nothing spectacular, but very good compared to the majority of Japanese net-nets.
At 0.39x of book value, investors are getting a stock that has compounded BV/share by 9.3% annually for 10 years, in addition to offering a 2-3% dividend yield since 2009.
Mitani’s P/B multiple has averaged 0.52x over that time period, with a trough of 0.21x during the depths of the crisis.
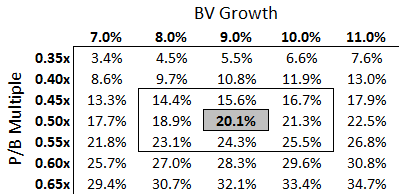
Here are a range of IRR scenarios using BV growth and P/B multiples, starting with the 3/31/12 BV/share of ¥2,429 and forecasting through FY2015:
If the stock trades back up near its historical P/B range of 0.5x and continues growing BV/share at 9% per year, the resulting IRR would be 20% per year (or roughly 22.5% with dividends included).
On a P/E basis, Mitani’s multiple has averaged 7.4x over the past decade vs. a current TTM P/E of 4.1x, so a return to long-run averages would imply a price target of ¥1,719, or 81% upside.
Conclusion
Several recent articles have highlighted the potential in Japanese small-caps:
Managers see big profits in Japan’s smaller-caps
Ex-Goldman Trader Run-Symphony Seeks Money for Hedge Funds
This renewed investor interest could lead to more activism in this unloved space.
To conclude, it might be helpful to provide a quick illustration of the potential with many of these Japanese net-nets. Consider:
1. If these activists and hedge fund managers can shake up the situation in Japan (a big if)
2. And market valuations return to more rational levels (probably a bigger if)
…then a growing, consistently profitable business like Mitani should never sell for less than net cash.
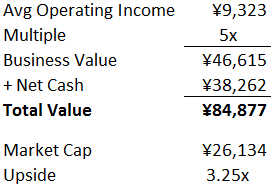
So what might someone bid for the entire company in a private transaction?
Getting bought out at a “fair” price is wishful thinking given the Japanese environment right now, especially in the small-cap space, but even a return to NCAV within the next few years could offer double digit annual returns.
Disclosure
Long Mitani

