This is another update on recent news and results for some of my current stock holdings, following the theme from my post on first quarter results.

To be efficient, I’m once again going to combine several short blurbs into a single post.

Access Plans Inc (APNC)

APNC continues its amazing growth trajectory, recently reporting a 155% increase in fiscal second quarter earnings (which follows a 69% increase in Q1 earnings).

Quarterly revenue increased 5%, as solid gains in the Wholesale Plans (+12%) and Retail Plans (+4%) segments were partially offset by a decrease in the Insurance Marketing (-6%) segment.

The company benefited from a large decrease in direct costs, fueling the large jump in earnings.

Consider: In the first six months of the fiscal year, APNC has already earned more net profits than in all of 2010.

APNC is throwing off a ton of excess cash, with the net cash balance growing to $8.89m this quarter. Despite this rapid growth, the stock continues to trade at less than 5x TTM EV/EBIT and less than 8x EV/FCF.

As a continued vote of confidence, one of APNC’s largest shareholders, Russell Cleveland of Renn Capital Management, increased his stake by over 350k shares to 10.1%.

While there has been no news, the assumption is that the company is still exploring strategic options for unlocking shareholder value, including a going private transaction – I see this has a strong potential catalyst.

Iteris (ITI)

On a pure numbers basis, ITI is out of place when compared to the majority of my portfolio (which is focused on companies trading at a discount to assets, such as Fuji Oozx or IBAL).

ITI recently reported fiscal fourth quarter fiscals for 2011, with revenues up 4% as compared to the same quarter last year, primarily driven by the recent acquisition of Meridian Environmental Technology (MET).

The company continues to see strong growth in its product businesses, but revenues were held back by weakness in the Transportation Systems segment.

Operating income for the quarter was $0.67m, down from $1.19m last year, primarily due to increased sales and marketing expenses and costs associated with the MET acquisition.

For the fiscal year, the numbers are not great, with the company reporting an operating loss of $4.7m due a large impairment charge taken in the third quarter – backing out the impairment charge shows operating income roughly flat when compared YoY.

This impairment charge also has no effect on cash flow, as the company reported almost $5m in FCF. ITI’s cash balance now sits at $11.8m, offset by roughly $3m in debt.

Despite a history of losses, Iteris reported its fifth consecutive year of profitability, and has paid down over $11m in debt since 2007.

Iteris is probably considered more of a growth stock rather than a true value play, but it’s a name where I believe in the industry trends that back  the company’s technology.

Consider these points from the latest conference call and recent investor presentation:

  • Expect Global Intelligent Transportation System (ITS) Device Market to reach $65b by 2015, up from $24B in 2010, growing 22% CAGR
  • Road and other infrastructure spending projects usually project $1.50 back as return for each $1.00 invested – comparatively, spending on management infrastructure (in ITI’s sweet spot) usually sees a 7x or more return for each $1 invested
  • Next Federal Highway Bill will provide a ‘shot in the arm’ for growth – expected to pass this year
  • EU mandate for LDW in commercial trucks will start boosting sales in 2013 ; by 2015, expect 10-20x increase in demand

ITI management sounded very bullish on the latest conference call, with the CEO saying that he expects Iteris to do $100m in sales within the next 18 months!

The stock has struggled, but it’s hard to come up with a valuation less than $2/shr based on current metrics – if the growth materializes, the stock could appreciate significantly from current levels.

New Frontier Media (NOOF)

As opposed to ITI, NOOF violates my rule to avoid investing in business facing industry headwinds. NOOF is not in a great industry, and is therefore ignored by many in the investing world.

But at some point, even unloved stocks in bad industries are just too cheap to ignore.

NOOF reported $48.7m in revenue for fiscal 2011, down 3.4% from 2010, continuing the string of slow but steady declines going back to 2007.

After taking a string of impairment charges over the past few years, operating and net income have both been ugly, but appear to be trending in the right direction – net losses have improved from $5.2m in 2009 to $1.7m in 2010 to only $0.8m in 2011.

The company will likely see continued pressure in the domestic Transactional TV business (the main source of profits). Growth is manifesting nicely however in international markets, where sales have increased 64% YoY to $5.9m.

Despite the GAAP losses, the company has enjoyed positive operating and free cash flow going all the way back to 2004.

The cash pile just keeps growing, and NOOF now sits on $18.8m in cash offset by no debt.

Management made a number of strong moves during 2011, including consolidating facilities and investing in new storage equipment.

These measures caused capex to jump to over $5m during the year.

In 2012, the capex figure should drop significantly, as the business only requires a normal ongoing capex of $0.3m per year.

While the business may be in decline, it’s hard to see a future where NOOF disappears overnight – the business should continue to throw off cash for the medium-term.

At these prices, the stock is selling at a 45% discount to book value and only 2x FCF, for a FCF yield of almost 50%.

That’s just too cheap in my book, and I expect to see management return some of the excess cash to shareholders once the business stabilizes.

Disclosure

Long APNC, ITI, & NOOF

This week marks the one year anniversary of ValueUncovered.com!

Since launching back in May 2010, the blog has been visited over 50,000 times and now boasts 750+ RSS subscribers.

Even better than the anonymous statistics, I’ve also heard from a large number of readers via email, and these discussion with other value investors has been absolutely invaluable.

Looking back on some of my old posts,  I think my analysis has certainly evolved and hopefully improved, but I remain committed to many of the same core beliefs as to when I started – a focus on obscure, undervalued, micro-cap stocks and special situations.

Favorite Posts

Here are just a few of my favorite posts:

A Journey Through the Pink Sheets – 3,698 Stocks Later

Probably my most ambitious investing project to date, I went through every pink sheet stock one-by-one to narrow it down to a watch list of several hundred securities.

The post generated more emails and comments than any other, and I now have a great list of stocks to keep an eye on – stay tuned as I will probably be writing about many of them over the coming months.

Evolution of My Value Investment Philosophy – Part I

Evolution of My Value Investment Philosophy – Part 2

A two part series, this describes the evolution of my value investing philosophy, from dividends to FCF to CROIC to special situations and beyond. I’ve come a long way from 2007 – when I first started investing – I still cringe at some of the mistakes I made during that initial half year.

But after switching over to Zecco in early 2008, and really taking investing seriously, my investing strategy has evolved and the results along with it. There is always room to improve, but I am happy with the progress I’ve made since I started writing down my ideas last year.

Newly Expanded Value Investing Resources

One of the most popular pages on Value Uncovered, my resources page goes through the tools and resources I use to find many of the investing ideas posted on this site.

Hopefully the number of page views is proof that readers are getting significant value from the links provided – I have an update planned soon, so keep an eye on the resources page for new additions.

Thank You

Most of all, I want to thank all of my readers, commentors, and other value investors who have helped promote Value Uncovered. The support is great, and I would encourage others to join in on the conversation, whether by commenting on, sending in guest write-ups, or dropping me a line via email.

Hearing from other value investors and discussing ideas is one of my favorite parts of running the blog.

After 120+ posts, it’s still going strong.

Happy investing!

Buying companies at a discount to their net asset value is a strategy that has outperformed the markets for decades.

2008/2009 provided an amazing opportunity for net-net investing in the U.S., but most of the bargains have now disappeared, and the current qualifying stocks are unattractive, ugly businesses.

After making the switch to Interactive Brokers, I now have access to the world’s stock markets, and have actively been trying to diversify my holdings internationally.

Investing abroad provides a host of challenges – accounting variations, currency risk exposure, language barriers, etc. – so sticking with a proven, mechanical strategy such as net-net investing is the easiest pathway into new markets.

And there is no other place in the world with more quality net-nets than Japan.

Fuji Oozx (7299:TYO)

Fuji Oozx is a Japanese maker of engine valve components used in the auto industry. It has been in business for almost 60 years.

I came across the stock using a new screener, Screener.co, that is the best global stock screener on the marketplace (note: affiliate link)

Fuji has several operating subsidiaries and is partially owned by Daido Steel, one of the world’s largest manufacturers of specialty steel ($2b market cap).

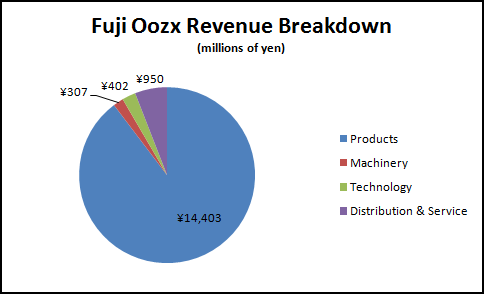
The company operates in four business segments:

“The Product segment manufactures and sells engine valves and others, as well as manufactures molds through one of its subsidiaries. The Merchandise (Machinery) segment sells mechanical equipment and jigs. The Technology segment is involved in the licensing of technology to its associated companies. The Distribution and Service and Others segment is involved in the transportation of its products, as well as the provision of employee welfare services. “

Fuji Oozx Revenue Breakdown

The Products segment makes up the majority of revenues and profits.

Financial Information

Fuji Oozx Financial Overview

Results for the year ended March 31, 2011 were  reported a few weeks ago. Revenues jumped 18%, to ¥16,062 million, as Fuji was one of the few net-net stocks showing significant revenue improvement.

These results were driven largely by a 17.2% sales increase in the Products segment, although all four operating units reported gains for the year.

Historically, the business is capable of producing revenue in the ¥20,000-22,000 million range (as evidenced by 2006-2008 results), leaving additional room for top-line growth.

Operating income jumped to ¥1,803 million, an increase of 141% from ¥746 million in the previous year.

Profits were down significantly in 2009 and 2010 as Fuji faced reduced demand from auto manufacturers during the worldwide recession.

The strong increase in operating profit led to operating margins around ~11%, a sharp increase from the 6% average margins from 2008-2010, but consistent with the company’s margins in the boom years of 2005-2007.

Operating cash flow is strong at ¥2,314 million, and the company has generated positive free cash flow for at least the past six years.

For fiscal year 2011, free cash flow (using owner earnings) was positive ¥998 million, for a FCF yield of almost 15%.

Balance Sheet

While the positive operating results are a great sign, the investment thesis relies heavily on the balance sheet.

At current prices, Fuji Oozx is trading for less than net cash, meaning the operating business is available for free.

The most recent year shows a cash balance of ¥6,964 million, compared to a market cap of roughly ¥6,719 million, meaning the market is assigning a negative value to the operating businesses.

This translates into an enterprise value of negative ¥245 million yen…for a business that has produced an average operating income of ¥1,728 million for the past ten years.

Net Current Asset Value (NCAV) is ¥11,254 million, so the stock is currently trading at only 60% of its NCAV value.

It just so happens that Ben Graham’s original rules on investing in net-nets called for at least a 33% discount to NCAV, so Fuji Oozx qualifies under even the strictest definition of net-net investing.

Book value is ¥965.75 per share, translating to a ridiculously low P/B of 0.34x.

Over the past 6 years, book value has grown at 4.15% while shares outstanding has remained constant at 20.5m.

Valuation

For a Japanese company, Fuji Oozx actually has decent operating ratios. TTM ROE is 4.7%, held back by the excess cash balance, but CROIC was 13.8%.

A traditional multiple-based valuation metric (such as EV/EBIT or EV/FCF) doesn’t provide much insight since the stock currently has a negative enterprise value.

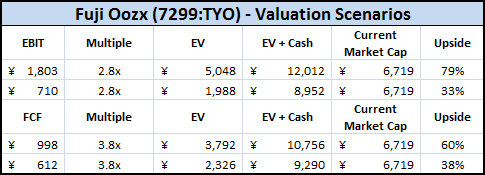
But looking at the past 6 years of financial results, Fuji Oozx’s EV/EBIT and EV/FCF multiple has averaged 2.8x and 3.8x respectively.

Here are several valuation scenarios, using both 2011 results and 2009 results (Fuji’s recession-low):

Fuji Oozx Valuation Multiples

It doesn’t make sense to spend a great deal of time on valuation scenarios – at these prices, Fuji Oozx is ridiculously cheap.

Risks

Even so, there are certainly risks to investing in Fuji Oozx.

Earthquake

Obviously the Japanese earthquake has caused severe disruptions throughout the region, with an economic cost in the hundreds of billions of dollars.

It doesn’t appear that Fuji’s Oozx locations were damaged in the quake, but it has caused problems with some of the company’s major customers.

The full financial outcome of the quake probably won’t be known for several months, as it occurred too late in the quarter to impact the most recent results – there is a chance that Fuji’s results could be materially lower.

At this time, the company is not making any predictions, as results are still uncertain and difficult to predict.

Fuji USA Liquidation

The latest annual report also shows that the company decided to close down its USA subsidiary, which has been in operation since 1994.

I couldn’t get a good sense of why the decision was made, but the company already took a ¥130 million charge related to the liquidation.

Subsidiary Problems

Fuji also announced a ¥221 million charge related to bad loans in the company’s Shinhan Valve subsidiary. I was unable to determine whether this charge has already been taken or if it will apply to next period’s results.

While this revelation is a yellow flag around the company’s internal controls, Fuji has several subsidiary companies, the backing of a major steel corporation, and a long track record in Japan.

I view this revelation as an isolated incident which doesn’t materially affect the investment thesis – it hardly makes a dent in the company’s cash balance.

Currency

Finally, I invested directly in the stock on the Tokyo stock exchange, meaning I had to convert US dollars into Japanese yen. The exchange rate between the dollar and yen is roughly 1 USD = 82 yen.

The historical exchange rate is probably closer to 1 USD = 110 yen.

If the exchange rate moves closer to its historical average, it would cause a loss on the currency part of the transaction.

Conclusion

Even with an overvalued currency, Fuji Oozx and other Japanese stocks are substantially cheaper than their U.S. counterparts.

Fuji Oozx could likely see results suffer in the next period or two, as the auto manufactures and the rest of Japan suffer from power outages and lower output as a result of the earthquake.

Full productivity is unlikely to return until later this year.

But the company has been in business for 60 years and, despite the short-term setbacks, will likely remain in business going forward.

Some value should be assigned to a profitable operating business.

This is a great example of Mr. Market mispricing a public security – no rational seller would ever let go of a piece of a profitable operating business for free.

As for the currency, there are several options to hedging this risk, but I’ve decided to let mine ride for now.

All of my assets, as well as my retirement savings, job, car, household possessions, etc are all based in U.S. dollars and I’m not very bullish on the dollars prospect’s going forward.

Therefore, some currency diversification is prudent.

From a portfolio perspective, I’ve set aside 10-15% of my portfolio to invest in Japan, and will likely spread that money over 3-4 companies.

Investors have been losing money in Japan for 20+ years, but as a value investor, you just don’t get too many chances to pick up profitable businesses at these prices.

Disclosure

Long Fuji Oozx (7299:TYO)