Like most investors, I studied a number of different approaches for investing in the stock market. The number of different strategies is virtually limitless, but I’ve always been drawn to a more fundamental value-based approach.

However, there are subtle differences within the value discipline itself and with how those principles apply to various investment types or methodologies.

Warren Buffett learned the basic investing methods from Benjamin Graham – but today, Graham would probably disagree with some of Buffett’s latest decisions.

Buffett’s approach has evolved over the years.

With several years of experience under my belt, I wanted to look back at my own evolution as an investor.

Dividend Increases = Income

A large portion of the historical return in equities is due to dividends, and this was one of the first places I looked when I started investing.

I paged through the Dividend Aristocrat and Champion lists, looking for companies that had regularly increased dividends, often for decades in a row.

There was something attractive about receiving that steady, quarterly deposit into my brokerage account, and then re-investing it back into more shares of the business.

As long as a dividend stock was purchased at a reasonable price, those dividend increases could provide a sizable return, especially over the long run.

However, I quickly realized that my investment goals did not match up to those of an income investor. While dividends are still core to my analysis, I no longer focus exclusively on them.

I am young and extremely driven.

I wanted to beat the market and was willing to take on more risk to get there.

(I made a living playing poker – market swings are tame by comparison!)

FCF is King

I quickly learned that analyzing the cash flow of the business is one of the most important indicators for long-term investing success. It is usually much better than the often-manipulated earnings numbers loved by the Street.

The best businesses – with the largest competitive moats – are able to grow FCF at a steady pace through the ups and downs of the business cycle.

These businesses are often large-cap stocks, having stocked up on brand reputation built to withstand minor fluctuations in the market.

When running stock screens, I looked for businesses that not only had positive FCF for the past 10 years, but were able to grow that cash flow every single year.

Then, by forecasting out future FCF increases and discounting back to the present, an investor tries to pick up shares at a discount to their intrinsic value.

Despite a solid method, finding quality businesses was difficult as many in this category (never having a down year) trade at a significant premium.

Sales are rare.

However, the financial meltdown in 2008-2009 touched even the most well-regarded businesses, and I managed to purchase many leading names at rock-bottom prices.

As the market rebounded, the discounts disappeared, and I continued searching for value in other market areas.

CROIC as a Key Metric

Largely influenced by the writings at FWallstreet (I cannot recommend Joe’s book and blog posts enough), I began to search for businesses with high CROIC. According to Joe, CROIC

“tells us how much cash our company can generate based on each dollar it invests into its operations.”

It is a great metric for evaluating companies, and it was possible to build a screen using Stockscreen123 to search for stocks with CROIC as the primary input.

Both ADVC and NOOF were found using the metric.

This number also became the basis for the growth rate in most DCF models.

OSV even provides a screen showing that businesses with improving CROIC substantially beat the market in the long run.

Over time, I kept running into the same companies over and over again, so it was time to look for opportunities using new methods.

Continued – Part II

Disclosure

Long NOOF, ADVC

A Training Exercise in Blind Stock Valuation

Posted February 1st, 2011. Filed under Stock Analysis

Geoff from Gannon on Investing recently announced a Blind Stock Valuation challenge. To quote the contest:

“Here’s my advice for how to really learn to value a stock. Start with a stock that’s pretty easy to value and completely unknown to you. Don’t look at the stock price! Just try to value the whole company.

Ideally, you should be able to black out the company name, business description, and stock price on a Value Line page and still be able to come up with an approximate appraised value for the business within 10 minutes.”

Good advice.

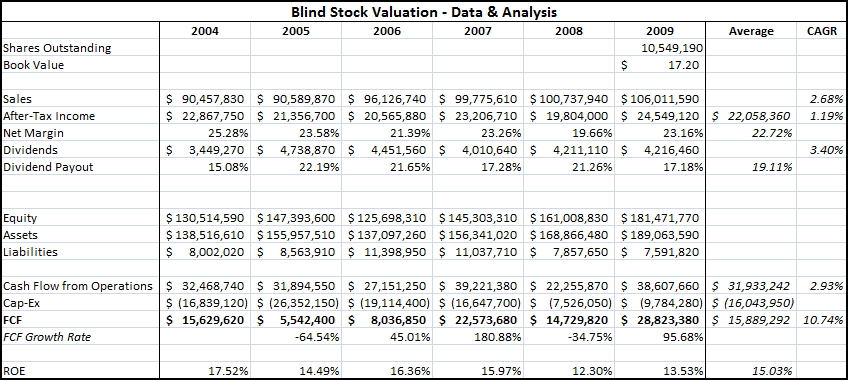
Here are the financial numbers provided:

Blind Valuation Financials

And here is my entry.

Financial Overview

The stock has shown remarkable consistency, and even growth, despite the market turmoil in 2008-2009. Sales have increased every year, albeit at a slow and steady pace of 2.68% annually.

Dividend payout have been steady, averaging 19% of net income over the time period, which seems to be sustainable.

The company has generated free cash flow in each year, but has cutback on capex spending significantly in 2008-2009, possibly in response to the economic conditions.

The company has little or no debt, with only $7.5m in liabilities compared to shareholder’s equity of $181m in the most recent year.

The most eye-catching number is the company’s net margin, averaging 22% over the time period in question.

Industry Commentary

Only a handful of industries (maybe 6-7) command double digit net profit margins across the industry peer group. Most of the qualifying industries are commodity-based, and therefore would suffer from much larger swings in operating results.

Another possibility is technology, but dividends are rare in technology companies of this size.

Healthcare would be my first choice (probably a medical device/supply company vs. a drug company, although drug company’s do tend to have higher margins)

Industry association is pure guesswork at this point, but I’d imagine that the company is near the top of its peer group based on the combination of high margins, steady growth, consistent dividends, and respectable ROE.

Valuations

Book value sits at $17.20/shr, forming a nice floor to the valuation range.

Multiples

Average earnings were $22m, or $2.09/shr. Healthcare companies generally command multiples higher than average. Assigning a 18x multiple translates into a share price of $37.62 (or 2.18x book value).

Average FCF was $15.8m – despite significant fluctuations, the company has managed to grow FCF at 10.7% annually. Most of the increase is due to reduced cap-ex, as operating cash flow has grown at a much slower rate.

Assigning a 15x multiple would translate into a market cap of $238m, or $22.59/shr.

Conclusion

The various methods provide a wide range of values between $17-$37 per share. I’d place a heavier weighting on the FCF multiple over earnings (60%/40%) and come up with a blended value of $28.60/shr.

Normally, I look for a 50% margin of safety for microcap companies, which would translate into a buy price around $14.30.

This lines up very well with a buy target FCF multiple of 10: (10 * 15.8m = market cap of $158m or $15.04/shr).

If the company really is a leader in its industry, I’d be interested in taking a much closer look if it ever dropped below book value.

Data & Analysis

Blind Stock Valuation

Disclosure

No positions in this mythical stock – but I’m intrigued! 🙂

Weekend Values – January 30, 2011

Posted January 30th, 2011. Filed under Investing Links

As usual, here are a some value investing links from the past few weeks:

Alapis SA (APSHF.PK)

Long Thesis. Most investors would agree that Greece is in big trouble. However, often the best bargains appear when the rest of the market is running away.

OSV presents a nice guest writeup on Alapis SA, the leading Greek pharmaceutical company.

The business has remained profitable during the crisis despite a large debt position and receivables balance, and overall exposure to the Greek government.

The result is one of the most statistically cheap stocks I’ve ever seen, trading at a P/E of 2.7 and P/B value of 0.075!

Despite the possibilities of a complete meltdown in Greece, it is an idea worth considering.

Pulse Data, Inc. (PSD.TO)

Long Thesis. This week’s SumZero writeup and also featured on AAOI, Pulse Data is a Canadian company that controls the 2nd largest library of seismic data on much of Western Canada.

It is a great business (once the data is collected that is – it is very expensive to initially gather), employing EBITDA margins above 50% and a FCF yield north of 25%. The company recently made a decent-sized acquisition, so the old company insiders have been liquidating their new position in PSD, putting downward pressure on the stock.

As for catalysts, the company is aggressively paying off the debt balance and seems committed to paying a dividend within the next 12 months. Increased insider buying is also a good sign as well.

RadioShack (RSH)

Long Thesis. A favorite among many value investors (and featured on Weekend Values a few weeks ago), RadioShack released disappointing preliminary Q4 earnings. In addition, the press release also announced that the company’s CEO, Julian Day, would be retiring.

The stock dropped sharply on the news despite the fact that the business continues to be profitable and earns high returns on capital. The share repurchase program is one of the most aggressive I have ever seen – the company bought back roughly 20% of shares outstanding in the previous quarter alone.

Even using conservative estimates, the stock trades at approx. 4x EV/EBITDA, which is extremely cheap, especially when compared to some of the latest retail buyouts like J. Crew.

Balkrishna Industries (BOM: 502355)

Long Thesis. For those investors looking for exposure to foreign markets, this is a great writeup on India’s leading manufacturer of off-road tires, Balkrishna Industries.

BKT is a decent-sized company, with a market cap of $11.5B INR (~$250m US) and a presence in over 120 countries. The stock trades at an EV/EBITDA value of approx 5.5 despite growing at 30% per year over the past five years.

Management is putting billions into a new production plant that will expand capacity by 70% by 2014, and has a track record of producing strong returns on capital, with a pre-tax ROIC of 26%, 22.5%, 21.8%, 19.6%, and 23% over the past five years.

2009 – 2010 Spin-off & Parent Company Stats

Special Situations. The Special Situations Monitor has put together a great list of the major corporate spinoffs over the past two years. Only two spin-offs (and 3 parent companies) trailed the market since the event.

Spin-offs have been proven to beat the market in the long-run so all of these stocks are worth watching closely.

Suggestions

If you have links or suggestions to detailed analysis from other value investors, please drop me a line using the Contact Form.

I’m always open to ideas from other investors, especially for a thoughtful and well-researched investment articles.

Disclosure

No positions.