This is a guest post for Jordan Topal, a long-time reader and value investor.

IEH Corp (IEHC)

[table id=7 /]

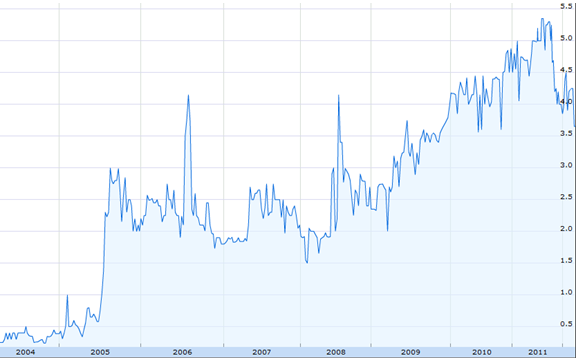
Price Chart

IEHC - Price Chart

To estimate where the stock normally trades, I eliminated some of the larger price spikes, and using the previous year’s earnings from FY04-FY11, I estimated the median annual low P/E was 6.08, and the median high P/E was 13.15.

Company Overview

IEH Corp designs and manufactures connectors for military and commercial applications. It sells mostly through independent reps in North America, Europe and Asia. While it has a standard line of products, the company engineers will also work with the customer to create job-specific connectors. In 2011, 69% of sales were to the military, compared to a 73% average over the last ten years.

IEH’s connectors use hyperboloid technology, which uses curved wires to ensure the male and female parts of the connector maintain contact through any amounts of shock or vibration. It’s the same technology the competition uses, and has represented almost all of the product sales for over 15 years. These connectors are sold to end manufacturers of finished goods as a component of the final assembly (think of Raytheon using the connector as a part of a missile system). Since the products are similar, IEH has to focus more on service, customizing the products for the buyer.

The company was created in 1937 as the Industrial Heat Treating Company by Louis Offerman. Louis was succeeded by his son Bernard, and today Michael Offerman is the third generation CEO/Chairman of the firm, having served as CEO since 1987 and on the board since 1973. David Offerman, the VP-Sales, joined the firm in 2004 and is the fourth generation Offerman to work at IEH. Michael Offerman owns 40% of the company.

Paul Sonkin of Hummingbird Capital Management owns 13.2% of the company, with signification ownership first being stated in a 13D filing in April 2007.

Qualitative Overview

IEH’s competitors operate as subsidiaries of a multinational corporation – Smiths Group plc – and are banded together under Smiths Interconnect as Hypertac Ltd. Hypertac used the strategy of acquiring all competing makers of hyperboloid connectors, leaving IEH as the only independent manufacturer in the US. IEH tries to separate itself from the competition by offering custom engineered connectors for specific applications, while many competitors just sell from a catalog.

Both IEH and Smiths Group note that government spending reductions could hurt their revenues and margins (as happened to Smiths’ other defense areas in 2011), but both continue to see solid revenue growth with their connectors.

Why hasn’t the much larger Smiths Group hurt IEH’s sales? One possible explanation is paragraph two of the latest 10-K report:

“We have been approved by the federal government as a “Hub-Zone small business Company”. This classification is monitored, and while the Company must remain competitive, it is taken into consideration by large business concerns when awarding military contracts in support of government programs. The federal government has mandated that major corporations being awarded government contracts must give a specific percentage of such business to “Hub-Zone small business enterprises”.

To qualify as a Historically Underutilized Business zone company, the business must be in a SBA-designated area, majority owned by a US citizen, fit the NAICS small business designation (less than 500 employees, where IEH has 121), and have 35% of employees living in the Hub-Zone. Interestingly, using the company’s HQ address, the SBA site says it doesn’t fall into a Hub-Zone location, though it’s two blocks from the closest one.

IEH has been Hub-Zone company since 2007, which gives it a 10% price evaluation preference, and the government goal is to award 3% of federal prime contracts and subcontracts to Hub-Zone firms.

Between its standard products approved as military qualified product listings, the custom designed connectors for unique applications and the Hub-Zone small business company designation, the company has carved out a profitable niche in its industry.

Financial Overview

After the Gulf War, the military downsized its spending, causing IEH sales to remain in the range of 4-5mm between 1995 and 2004. But in the last 10 years, IEH has more than tripled sales. IEH’s top four customers account for 38% of sales.

The real impact on the stock price has come from the increase in margins. In the last decade, the company struggled with gross margins in the 26-29% range. But in the last five years it increased these margins to the 31-37% range, while also keeping the SG&A expense growth smaller in proportion to the top-line growth. This caused net margins to jump from 1-3% to 7-12%, leading to massive net income growth.

IEHC - Financial Overview 2

The company free cash flow is a much less compelling story: $0.08/share in the trailing twelve months, and $-.07/share in FY11. This is caused by a large buildup in inventory, specifically raw materials. The company has doubled sales since 2008 while raw materials have almost tripled. Most of IEH’s net income has gone towards purchasing raw materials, leading to the low free cash flow levels. The company’s most recent 10-Q states that it may purchase excess raw materials to take advantage of low prices or in anticipation of increased sales. From speaking with IEH, I gathered that the company was focusing on the latter, which makes sense as 2011 was a year with record backlog.

IEHC - Financial Overview

The company is debt free with $418k in cash, and owes an annual 150k and 111k for a building lease and pension expense. The pension is operated through the United Auto Worker’s union, and neither the plan net assets or unfunded pension obligation is available to IEH. Using the remaining lease payments, I estimated the present value of the building lease at $1.2mm.

Why the Fallen Stock Price, and Reason for Investment

From a high of $5.40 in August 2011, the stock price has fallen to $3.65. This coincides with two events. First, revenue in the September quarter was flat YoY, while December saw a fall from 2010 levels – a concerning fact since September and December had both seen YoY gains in each of the past four years. Second, the US declared an end to the Iraq War in December 2011 with a final large troop drawdown, as well as beginning large troop withdrawals in Afghanistan.

In short, it is doubtful that IEH will continue the previous trend by tripling sales growth over the next ten years. However, IEH doesn’t have a history of overinvesting in inventory, and combined with the record backlog levels it should indicate that the recent fall in sales should be the exception, rather than the rule.

The risk is that the connector market languishes under defense spending cuts, and the Smiths Group starts a price war for the remaining market share, cutting margins to the bone and creating a stagnant market like 1995-2004. A tighter margin environment like 2004-2005 would lead to a lower ROIC around 7-10%, as opposed to the 20-25% ROIC of the last couple of years.

The catalyst for the stock is the realization of anticipated increased sales, along with the eventual slowdown in raw materials buildup leading to higher free cash flow. At 1.12x book value and a 5.4 P/E, the current discount makes IEHC cheap enough to buy and wait for mean reversion towards the high end of the normal P/E range, with book value growth providing the margin of safety.

Resources

IEHC Filings

Smiths Group presentations/transcripts

Disclosure

Author of post is long IEHC


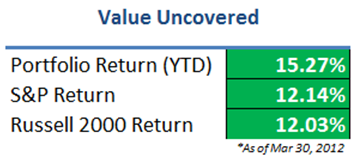
Value Uncovered Portfolio Performance - Q1 2012

After lagging the indexes for most of the way, a strong finish helped the portfolio outperform the index during the first quarter of 2012.

In fact, the 15% return was my third-best quarter ever, trailing only two mammoth quarters during the stock market recovery in mid-2009.

As I mentioned in my 2011 year end-review, many of my holdings are extremely illiquid and volatile, and price swings on or near the period closing date can have a big impact on the portfolio’s final performance number.

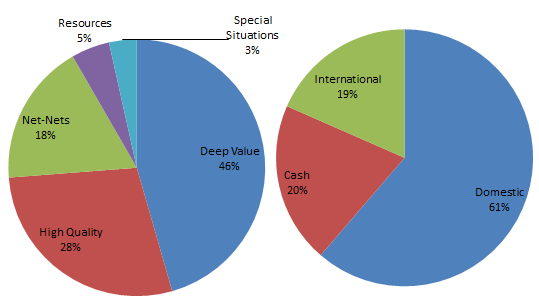
Portfolio Breakdown

Value Uncovered Portfolio Breakdown - Q1 2012

I continue to examine each holding in the portfolio, and have closed out or substantially reduced a number of legacy positions which have hit price targets or no longer fit into my investment philosophy.

The cash position will almost certainly increase due to buy-outs of several existing positions, so I’m on the hunt for new names and always open to hearing ideas from readers.

Position Updates

International Baler (IBAL) enjoyed a nice run-up after reporting a huge Q1. Sales were up more than 130% QoQ, and total backlog has increased to $7.8m compared to only $3.295m in the prior year. The stock is now up almost 400% since my initial post.

I’ve trimmed back my position significantly over the past quarter, but plan on holding onto the remaining stake – 2012 should be a record year.

Access Plans (APNC) announced a merger agreement with AON Corporation for $3.30/share, subject to certain revisions at closing. The preliminary proxy was filed on March 27, and it shed light on an interesting part of the agreement (emphasis mine):

“Prior to the closing of the Merger, Access Plans may declare a one-time cash dividend of up to $0.10 per share of Access Plans common stock then outstanding payable to Access Plans’ shareholders immediately prior to the closing (the “Special Dividend”). However, the Special Dividend is only permitted if (i) prior to the closing the full amount of the Special Dividend is paid to Access Plans’ transfer agent (for subsequent payment to the Access Plans shareholders) on terms and conditions acceptable to Affinity and (ii) the payment of the Special Dividend does not cause the net cash amount immediately prior to the effective time of the Merger to be less than $15.025 million.”

Merger and closing related expenses are estimated at $2.2m, so the ‘trigger point’ for a special dividend would be $17.225m.

As of 12/31/2011, APNC held $15.64m in net cash. In the previous year, the company generated roughly $8m in cash, or $2m per quarter.

If APNC continues to throw off the same amount of cash, and the merger closes at the end of Q2, those 2 quarters would give the company a cash balance in the $19m range.

If so, it’s likely that at least some (if not all) of the $0.10 dividend will be paid before closing, providing a nice boost even if another suitor does not emerge.

Access Plans is not the only holding that is ‘in play:’ New Frontier (NOOF) is the subject of an apparent bidding war.

The bidding started with an offer of $1.35/share by Longkloof Limited, which owns 15% of NOOF’s shares. Several weeks later, another potential acquirer emerged, with Manwin Holdings offering $1.50/share.

The interest caused NOOF’s management team to hire Avondale Partners to evaluate all alternatives:

“Our Board of Directors remains very enthusiastic about New Frontier Media’s future prospects and has made no decision to sell the Company. However, in keeping with our commitment to act in the best interests of all shareholders, we have decided to undergo a thorough review of strategic alternatives to determine the best opportunities for maximizing shareholder value at this time”

The stock is trading at a premium to the latest offer, so the market is certainly pricing in further action.

Finally, an activist investor emerged at Gaming Partners (GPIC), as Enclave Asset Management wrote a strongly-worded letter to the management team and proposed new board members at the upcoming annual meeting.

The company posted disappointing results for the fiscal year, with EPS falling from $0.54 last year to $0.45.

If nothing else, the quarter was certainly entertaining.

Disclosure

Long IBAL, NOOF, GPIC

TNRK - Financial Overview

Company Overview

TNRK designs, assembles, and sells batteries to a variety of industrial markets. The company purchases batteries from major and well-known manufactures such as Energizer or Sanyo, assembles the individual items into battery packs, and then maintains the inventory for sale and distribution.

The batteries are sold to OEM manufacturers, hotels/resorts, military, aerospace, and electrical wholesalers – TNRK even designs and assembles custom battery packs to customers’ specifications.

The company maintains two major distributions centers in Florida and California, and runs the websites www.batterystore.com and www.tnrbatteries.com.

Management & Ownership Structure

TNRK is family-held, with management and insiders holding 38% of the company. Wayne Thaw, the company’s Chairman of the Board and CEO, has been involved with the company since inception and held a management position since 1987.

His brother, Mitchell Thaw, serves on the board of directors and has an impressive Wall Street background, where he specialized in equity options and structured products, including running a $900M capital structure arbitrage fund.

The father, Norman Thaw, is a former director and still 17% of the company, giving the Thaw family effective control over the business.

Paul Sonkin of Hummingbird Capital Management, a micro-cap and nano-cap focused value investing fund, owns just over 65k shares, or 21% of the company, purchased in the 2007-2009 time period.

Financial Overview

TNRK is profitable but growing its top-line at 1.47% over the past ten years, not exactly an exciting growth rate and lagging inflation.

While the overall prospects for the battery industry remain bright (as society becomes more and more electronic), TNRK will continue to face significant challenges in growing its core business. In the company’s own words:

Battery wholesale distributors face increased competition as offshore (specifically China) and U.S. manufacturers continue to sell directly into the marketplace alongside an increasing number of web-based operations and expanding local battery franchises. Competitors continue to price their products aggressively which has a direct impact on the Company’s overall sales and gross margins.

Revenues peaked in 2006 at $9.72m, only to fall to a low of $8.73m in 2009. The company did show signs of improvement in 2010 and 2011, but sales seem to have stagnated around $9m.

Gross margins have remained steady in a range of 30-32% over the past five years . However, despite the lower sales, SG&A expenses increased from 18-19% of revenues to 24% in 2010 before falling to 22.7% in the TTM period.

Much of the recent decrease in SG&A can be attributed to a revision of the rental agreement for the company’s HQ, payable to a holding company owned by the CEO Wayne Thaw (the conflict of interest was disclosed in the annual report).

The lease agreement was renewed in 2007 at the height of the bubble, which made the rent expense seem high – the revised agreement provides a 27% lower rent payment to reflect depressed market conditions.

Operating margins have declined for the past five years to 6.3%, but seem to be leveling off around the 6% mark.

Despite the struggles in the industry outlook, the company has remained profitable in each of the past ten years.

Investment Thesis

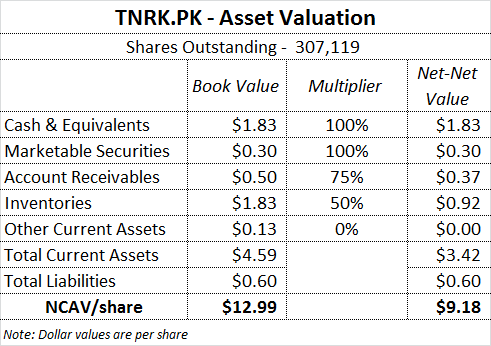
1. TNRK is a net-net stock and therefore extremely cheap on an asset basis – P/B is 0.68x, and at current prices, TNRK trades for less the value of the current assets on the balance sheet after subtracting all liabilities: 

TNRK - Asset Valuation

Even after taking downward adjustments for the A/R and inventory line items, adjusted NCAV (or liquidation value) is $9.18/share.

2. TNRK’s business fundamentals are actually decent – Many net-net stocks are in very ugly businesses with terrible capital allocation, high capex requirements, and inconsistent profits. While TNRK’s industry has its challenges, the core business requires little in the way of investment.

The company is overcapitalized (so ROE is low) but looking at the operating business itself reveals a decent fundamental picture: 

TNRK - ROIC Overview

ROIC has fallen from the 30-40% range but seems to have stabilized around 17-18%, which is very good for a net-net stock (remember, the market is basically assigning zero value to the operating business).

While TNRK isn’t a great business, it isn’t a terrible one either – management does not appear to be destroying value by keeping the lights on.

3. Management is paying out surplus cash to shareholders – Over the past several years, excess cash has been returned to shareholders.

Since 2006, TNRK has paid out $5.5m in three large special dividends, or roughly $18/share. 

Too many companies with surplus cash balances try to diversify into other business lines, or (even worse), blow the cash on a bad acquisition.

These payments should continue to be a catalyst for unlocking value for existing shareholders, even if business conditions do not dramatically improve.

Return Scenarios

Despite the negative trends, TNRK continues to throw off a ton of cash.

TTM FCF is $640k, which equates to a 23% FCF yield – if you choose to calculate FCF yield as FCF/EV, the result is an absurd 97% yield.

At these prices, the market is not only assigning zero value to the company’s inventory, it is assigning zero value to a profitable operating business that should generate $250k-$500k in annual cash flow over the next several years.

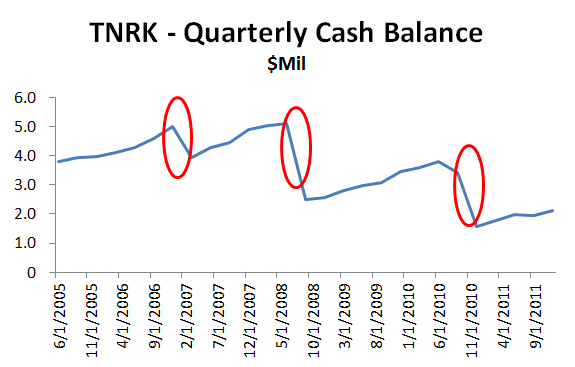
Consider the picture of TNRK’s cash balance over the past few years: 

TNRK - Quarterly Cash Balances

A nice pattern emerges: A run-up of excess cash over several quarters, then a special dividend to shareholders.

Keeping this pattern in mind, let’s assume that TNRK will pay out a $1m dividend at the end of each year that the cash balance reaches $2.5m.

I also simplified the calculations so that the annual change in cash = net income, as FCF has closely tracked income over the past five years.

Here’s how the scenario might unfold:

Bull Case

TNRK - Return Scenarios - Bull

In this case, two separate $1m dividends are paid over the next five years, returning ~70% of the purchase price – and leaving a cost basis of $700k for a profitable business with $1.5m in cash in the bank.

Bear Case

TNRK - Return Scenarios - Bear

Even under a more extreme scenario where EPS falls rapidly over the next five years, the company still pays a $1m dividend, returning 36% of the purchase price – and leaving a breakeven business with $1.76m in cash, few liabilities, and a several million dollars in additional current assets that could be liquidated.

Risks / Negatives

Tiny illiquid stock – TNRK often seems to trade by appointment. Many days or weeks can go by without a single trade, and even small blocks can cause double-digit price swings.

Management compensation is high – The top three officers took down $550k in salary and bonus in 2011, which is a significant chunk for a company with $9m in revenue (it is even higher if you include the rent expense to the CEO’s holding company, although TNRK would have to rent the space from someone).

Material business decline and/or obsolescence – Theoretically, TNRK’s suppliers could choose a different distribution channel and cutoff TNRK. The latest report also mentions a potential supply disruption in China due to more stringent environmental standards for lead acid batteries. If sales fall and management is unable to cut costs, the business could decline at an even more rapid rate, potentially limiting dividend payments.

Conclusion

This is a relatively simple investment case, as TNRK trades below its liquidation value despite a history of profitably and no signs of radical disruptions in the business outlook.

Through the first six months of fiscal 2012, the business is showing small glimmers of a turnaround (or at least a stabilization), with ROE, ROA, Gross Margin, and Net Margin all up over the prior twelve months.

TNRK is part of my basket of net-net stocks. Going forward, either:

1. The business model is not obsolete and conditions improve. Management is able to rein in the cost structure. Earnings return near historic levels.

Result: TNRK’s share price goes higher on a more rational multiple of earnings. Shareholders benefit from share appreciation and dividends.

Or…

2. The business continues on a steady decline, and management is unable to reduce costs to compensate for lower sales.

Result: The business stockpiles cash flow for several years, pays out special dividends, and eventually liquidates or goes private.

Both options seem to offer attractive returns over the next several years with limited downside – therefore, I continue to hold TNRK as part of my basket of net-net stocks.

Disclosure

Long TNRK