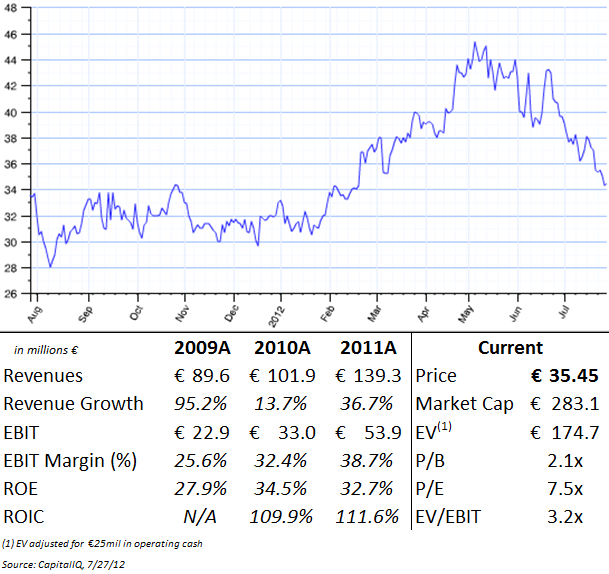
TIM - Financial Overview

Company History

Founded in 1999, Tipp24 SE (TIM) was an early pioneer of online lotteries in Germany and other European countries. The original business model had Tipp24 serving as an online broker to the German state lottery, essentially funneling lottery ticket sales through an online interface and keeping a 10% markup fee.

From 2002-2008, the number of subscribers grew from 0.4mil to 2.5mil (28% CAGR), as Tipp24’s market share rose to 60%.

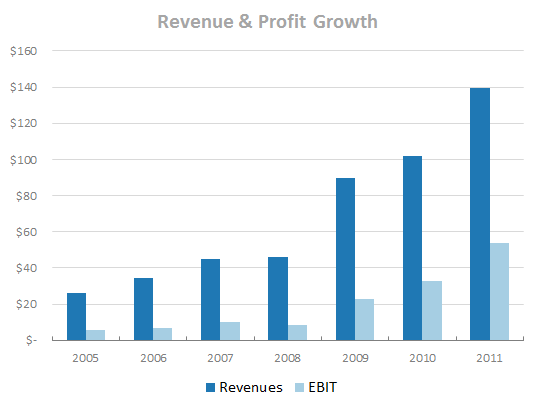
The stock went public in 2005, and has turned in a remarkable run since, with revenues and EBIT rising nearly every single year (a small EBIT dip in 2008 as the sole exception):

TIM - Revenue & EBIT Growth

Legal Environment

But in 2008, the German government ratified the State Treaty on Gaming (GIStv), which banned all online lottery brokering and advertising. This basically eliminated Tipp24’s core business, and management had to scramble to come up with a new strategy. The company ended up applying for a gambling license to begin operating secondary lotteries via a UK subsidiary.

In September 2010, the European Union proclaimed that the GIStv violated European law, and that Germany would need to submit a revised treaty.

Then in 2011, one of the German states, Schleswig-Holstein, broke off from the others and ratified its own state treaty to allow online lotteries starting in 2012 – meanwhile, the new GIStv is still making its way through the court system for the rest of the country.

While the lottery ban seems unlikely to stand forever, it has cost Tipp24 millions of euros in legal fees and lost business.

The legal situation remains complicated in Germany, but fortunately Tipp24’s management team finally decided to spin-off the old brokerage segment into a new company, Lotto24 AG (ticker: LO24), which began trading on July 3, 2012.

This action separates the legal fight in Germany from the UK operation, and it’s the UK business which will be the focus of the investment thesis. Despite all of the controversy and legal battles in the home country, the UK operation has thrived.

(To try to avoid confusion, the use of “Tipp24” and “company” references the new standalone UK business)

UK Business Overview

Tipp24’s UK subsidiary, MyLotto24 Ltd. (not to be confused with Lotto24, the new spin-off), operates a secondary or “virtual” lottery, allowing players to participate in lotteries such as the EuroMillions and German “6/49” lotteries.

Essentially, customers are “betting” on the traditional state lottery – keeping the same odds of winning the possible jackpot, but without having to physically go to the store and purchase a ticket. Tipp24 bears the risk if the jackpot is hit, but crucially, only pays if one of their customers is the winner.

The payout ratio is set at 50%, so Tipp24 keeps the difference between the price it charges for the lottery ticket and the expected payout, and then subtracts out a 15% UK gambling tax and any hedging costs to produce its overall profit.

Investment Thesis

#1) Attractive business model with high margins and free cash flow with little reinvestment requirements

Tipp24’s product offering is entirely online, and this asset-light business model is reflected in 2011 gross and net margins of 57.6% and 27.5% respectively.

Historically, the old brokerage model operated with negative invested capital.

In order to start-up the UK operation from scratch, management invested ~€30mil over the last four years, mostly in software upgrades. Total capital expenditures, including software and PP&E, were €36.5mil or roughly €9mil per year.

Even with this start-up investment, Tipp24 generated €54.3mil of EBIT (€38m after-tax) with only €31.7mil in invested capital. ROIC is more than 100% – this is a phenomenally profitable business:

TIM - Invested Capital

Management is forecasting total capex (including software) of only €3-5mil in both 2012 and 2013. Since software assets are amortized over four years and make up the majority of Tipp24’s non-cash invested capital, amortization will likely exceed reinvestment needs and ROIC should improve.

Limited capital requirements also mean that the company has significant free cash flow available for share repurchases or dividends:

TIM - Free Cash Flow Calculation

Even with the start-up costs, FCF has averaged €20.7mil over the last three years for a FCF yield of 7.3%, or 11.8% using estimated maintenance capex.

#2) Spin-off of German operations eliminates most of legal headaches, creating a catalyst (likely a large special dividend) within the next 12-18 months

Due to the legal situation, Tipp24 was forced to transfer control over its UK subsidiary, MyLotto24 Ltd. In effect, the company was trying to segregate the UK operations – running successfully since 2007 without political pressure – from the legal situation in Germany.

To accomplish the split, 60% of the preference shares in MyLotto24 Ltd. were sold to a Swiss foundation, as a way to show independence to German regulators. Importantly, Tipp24 retained a call option to repurchase the shares of Mylotto24 Ltd. from the Swiss foundation for £30k, and therefore can regain full control over the UK subsidiary at any time.

Once the corporate structure is simplified, the parent company would then have access to the subsidiary’s cash balance of €133.5mil, 47% of the stock’s current market cap.

A substantial amount of that cash would be excess, even considering the requirement to keep cash on hand to pay the deductible, so a large special dividend is likely in the next 12-18 months.

The company did pay a €0.50 per share dividend back in 2008/2009, equivalent to roughly 65% of EPS – that same payout percentage would result in a dividend per share of around €3.00 (an 8.5% dividend yield).

#3) New hedging mechanism improves cost structure, leading to potential margin improvements

Historically, Tipp24 hedged its jackpot exposure in two different ways:

– Via an insurance contract for the German “6/49” lottery, which kicked in for any jackpot payouts over €10mil

– Via “native hedging” on the EuroMillions and other lotteries, which meant buying a ticket with the same numbers and earning a profit through markup and distribution fees

In September 2011, the company announced a new hedging mechanism with the issuance of a three year €70.5mil catastrophe bond (CAT bond). This bond transfers the payment obligation to a third party while having Tipp24 retain the first €22.5mil in jackpot payments (i.e. its annual ‘deductible’).

Essentially, the new bond allows Tipp24 to eliminate native hedging whenever the EuroMillions jackpot is less than €50mil – before, the company had to hedge every ticket sold regardless of the jackpot size. These hedging costs were significant, running around 10-11% of UK revenues:

TIM - Hedging Costs

Through Q1 2012, hedging costs have fallen 49%, from €5.0mil to €2.6mil – annualizing this figure results in a FY cost of €10.24mil, for a savings of €6.3mil.

This new strategy could boost EBIT by €5-6mil in 2012, without any growth in the number of players or popularity of the EuroMillions product, which seems conservative.

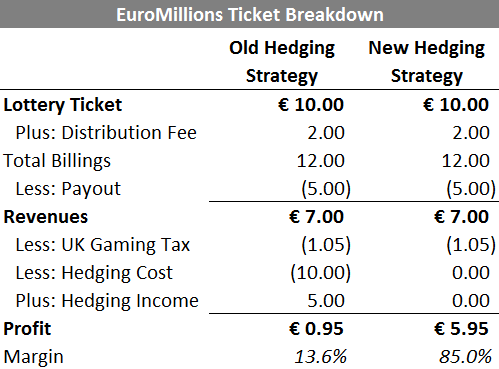
To make the benefits clear, here is an estimate of the economics of the EuroMillions lottery ticket, under the new strategy (i.e. no natural hedging required):

TIM - EuroMillions Ticket Breakdown

While not representative of true margins (there are other direct expenses, and the company will have to hedge tickets anytime the jackpot is over €50mil), it does showcase the benefits of this new strategy.

Valuation

Due to the legal uncertainty, the Germany segment posted €26.5mil in operating losses over the past three years, which must be removed for the new standalone company.

In addition, statistical fluctuations should be excluded to get a better picture of the UK’s earnings power, assuming the “average or expected” result:

TIM - Segment EBIT

Management is forecasting revenues of at least €130mil and EBIT of €35mil for 2012.

However, this EBIT forecast builds in a €10mil buffer for statistical fluctuations, so the true EBIT forecast is €45mil. Even this number seems conservative considering:

a) the potential cost savings from the new hedging strategy

b) the spin-off of the costly Germany segment

c) any growth from re-focused operations and management attention

2011 earnings were skewed upwards by an insurance payment, counterbalanced by charges for the C-bond issuance, costs related to the spin-off, management changes, etc.

Let’s say that normalized earnings are €50mil per year – or €35mil after-tax.

With limited reinvestment needs, net operating profit after tax (NOPAT) matches up almost exactly with free cash flow.

Capitalizing the €35mil number at a 10% discount rate yields a no-growth value for the operating business of €43.83/share, or 24% upside from the current stock price. This valuation is giving no credit for all of the excess cash on the balance sheet, plus any additional growth opportunities.

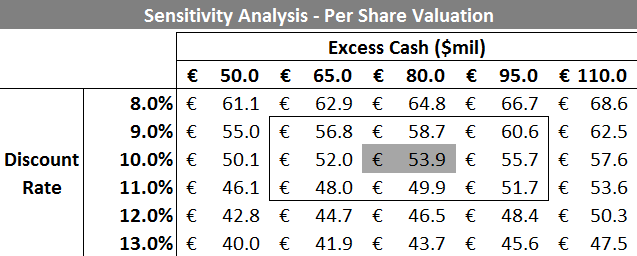
Here are the upside scenarios at varying discount rates and estimates of excess cash:

TIM - Per Share Valuation

Put another way, the base valuation of €53.85/share (52% upside) is consistent with 9.5x P/E, plus the ~€85mil in excess cash – a rather conservative multiple for such a profitable business model.

Risks

Regulated operating environment – Gambling and lotteries are heavily scrutinized activities, and Tipp24 runs the risk of legal or political changes which could negatively affect the business model.

Negative statistical fluctuations – Even with the new hedging strategy, the company is still on the hook to pay jackpots up to €22.5mil, and lottery results could run below expectation for an extended period of time. Unlike other business models, poor results can occur purely by chance.

Management turnover – The size of both the executive and supervisory boards have been changed several times – for example, Marcus Geiss was added in April 2011, but left prematurely in April 2012. The current CEO and co-founder, Dr. Hans Cornehl, has been involved with the company since 2002, although the other co-founder left in 2009. Current management holds less than 1% of shares.

Conclusion

Essentially, Tipp24’s business model is rather simple:

In exchange for €25mil in invested capital (basically cash that is set aside in the case of a jackpot payout), Tipp24 takes a cut of potential payoffs (50% ‘rake’ on each ticket, less the cost of hedging), for running a secondary lottery – which just so happens to be more convenient to play than the real thing.

This €25mil in cash sits in the bank and generates €30-35mil in after-tax proceeds each year. Not a bad return, and better than a savings account.

To some degree, this is still a ‘wager’ on Tipp24’s part (essentially betting that two large jackpots won’t be hit back-to-back for example), but the jackpot odds are so small that the risk/reward is skewed heavily to the positive side.

No wonder lotteries have been around for hundreds of years…

Disclosure

Long TIM, LO24

Mitani - Financial Overview

Company Overview

Mitani Group (8066:TYO) is a Japanese conglomerate that operates in segments from concrete to semiconductors and from bowling alleys to nursing homes. With roots going back to 1914, the company now manages almost 100 subsidiaries – an overview of the group structure is included on the website.

Many of these subsidiaries have operations that are hard to categorize, but the company is broadly organized into three main segments:

Information Systems – includes CATV, software development, and outsourced IT services

Energy / Life Support – includes housing equipment, gas stations, and wind power generation

Construction Materials – includes building materials, concrete products, and aluminum sales

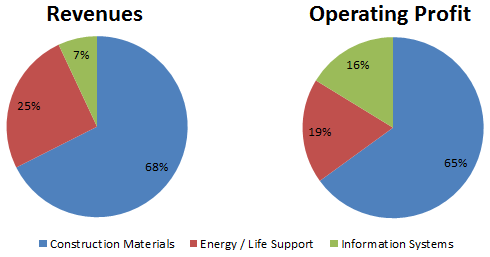
Of the three, the Construction Materials segment is the most important, accounting for almost 70% of sales and total profits:

Mitani - Segment Revenue and Profit Breakdown

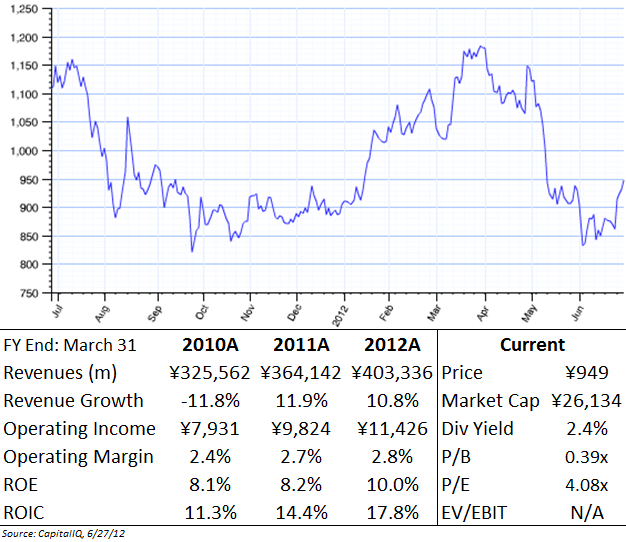
With a market cap of ¥26,134mm (~$330mm), Mitani is quite a bit larger than other Japanese net-nets like Maruka Machinery and Fuji Oozx.

Financial Overview

For the 2012 fiscal year, Mitani reported sales of ¥403,336mm, an 11% increase over the prior year and up 24% from recession lows. All three major business segments had positive growth, led by a 12% increase in the Energy & Life Support division.

Both operating and net income rose even faster, up 18% and 30% respectively, with EPS reaching a record of ¥232.

Over the past decade, revenues have grown 4.8%/year while SG&A costs climbed only 3.1%/year – these costs now consume 6% of revenue versus 8% ten years ago.

Unlike many other Japanese net-nets, Mitani does have some short and long-term debt on the balance sheet, totaling ¥9,919m, plus another ¥2,065m in retirement obligations.

However, this debt is offset by ¥45,136mm in cash and a very manageable debt-to-equity ratio of 16%.

Although Mitani has spent over ¥7,800mm on acquisitions over the past ten years, total goodwill and intangibles of ¥1,468mm is negligible when compared to ¥177,576mm in total assets.

FCF has averaged just over ¥5,000mm over the past ten years, for a FCF yield of almost 20%.

Investment Positives

Conglomerate structure helps dampen swings in economic cycle, which translates into smoother top and bottom line growth

Although Construction Materials makes up a significant portion of revenues and profits, the varied business lines among the operating subsidiaries insulate the company from economic swings.

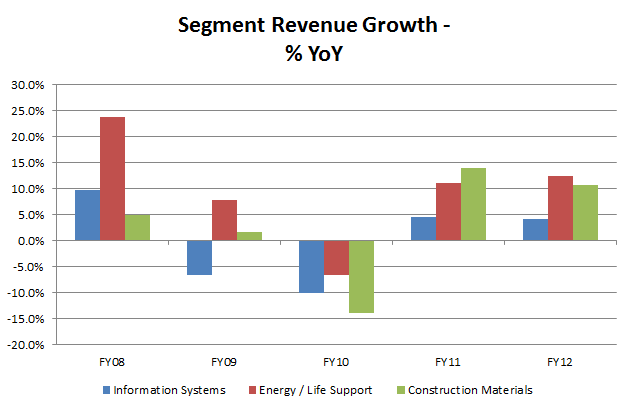
Here are YoY revenue growth rates for each business over the past five years:

Mitani - Segment Revenue Growth YoY

Every business struggled in FY2010, but historically, drawdowns in one segment (such as in FY09) can be compensated by growth in other areas.

Compare Mitani’s negative swings to several other Japanese net-nets:

Mitani - Peer Comparison Max 2 Year Drawdowns

This consistency has translated into 4.8% annual revenue growth over the past ten years, a solid result considering the economic environment in Japan.

Due to operating margin increases and share repurchases, EPS grew at 27% annually over that same time period.

Positive industry dynamics will translate into continued demand for construction materials over the next 2-3 years, boosted by domestic rebuilding after the Japanese earthquake

Many construction materials and supply companies saw a sharp jump in stock price after the March 2011 Japanese earthquake on anticipations of a massive rebuilding effort.

Mitani’s stock price hit ¥1,405 per share in early May, up 67% in fewer than 30 days post-quake – other construction stocks showed similar increases.

However, the price jump reversed itself quickly, and Mitani’s stock price returned to pre-quake levels only six months later.

While the initial thesis was straightforward – earthquake/tsunami damage leads to greater requirements for building products like cement and concrete – investors seemed to misjudge how long the process would take.

The fact remains that the rebuilding in many of the hardest hit areas has only just begun, as this USNews report shows: “Before and After: One Year After the Japan Earthquake.”

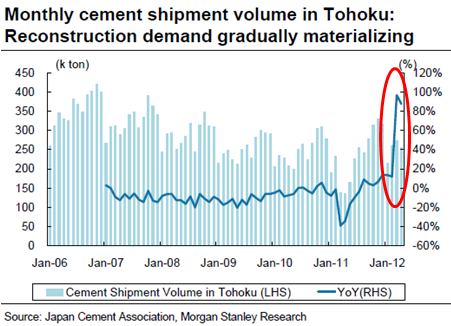
This is backed by cement shipments to those tsunami-affected prefectures (with cement demand being a good enough proxy for rebuilding efforts): 

Mitani - Monthly Cement Demand in Tohoku

Notice how the demand spike did not occur until the first two quarters of 2012, almost a year after the quake.

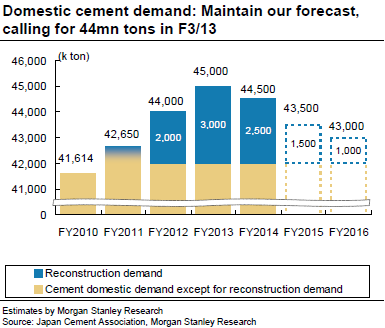
Analysts are expecting total cement demand to peak at 45b tons in FY2013 , with reconstruction demand providing a 3b ton boost:

Mitani - Domestic Cement Demand Forecast

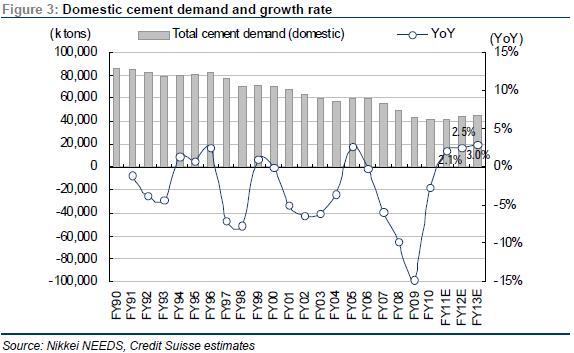
While growth in the cement industry has been modest, it reverses a two-decade trend of declining demand:

Mitani - Domestic Cement Demand

(Looking at the chart, FY2010 was a rough year: cement demand was half of the 1990 peak. That same year, total Japanese construction investment hit a low not seen since the late 1960s – truly staggering)

Mitani’s Construction Materials segment showed a 10% sales increase in FY2012, growth which should accelerate over the next 1-2 years.

History of conservative guidance softens impact of poor outlook in latest annual report

Despite the seemingly positive macro trends (at least in the construction industry), the FY2012 financial report provided a very conservative outlook for the coming year: sales up only 0.4%, operating income down 9.8%, and net income down 9.4%.

In the 30 days after the May 9th release of the annual report, the stock fell 18%.

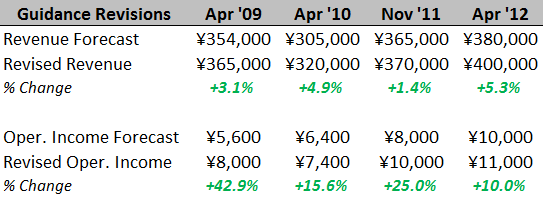
However, Mitani’s management has a history of conservative forecasts:

Mitani - Management Guidance Revisions

In each of the past three years, management has revised both the revenue and profit figures upwards – with the final result ending up even higher than the revised forecast.

While past history is no guarantee of future performance, the cautious outlook for FY2013 does not appear to be a major concern.

Availability of English-language financial statements

Not to be overlooked. While the raw financial numbers can be found in CapIQ or Bloomberg, Mitani publishes translated financial statements online.

This prevents translations mistakes (Google Translate struggles with Japanese. Trust me, I’ve spent hours trying to make sense of reports), and provides important information.

For example, Mitani clearly shows that ¥5,110mm of its long-term investments are Investment Securities.

While Mitani’s translated reports do not include financial notes or management commentary, even the provided info is lacking in many other Japanese microcaps.

Investment Negatives

Conglomerate structure – reduces chances of acquisition by competing firm, which is a key source of unlocking value in many microcaps.

Conglomerate discount – Markets often price conglomerates at discount to comparable pure-play companies (although discounting to zero seems a bit extreme).

Domestic-based – Mitani is highly dependent on the economic and political environment in Japan. Much has been written about the Japanese situation, with passionate arguments on either side. Readers can make their own judgments on the macro risks.

Currency risk – Many investors are betting on a weakening of the Japanese yen, which would reduce the holding period return when closing out a position and converting proceeds back to USD. Even with possible currency losses, the margin of safety with Japanese net-nets is huge – here are some interesting views on the yen and currency hedging (here and here).

Valuation

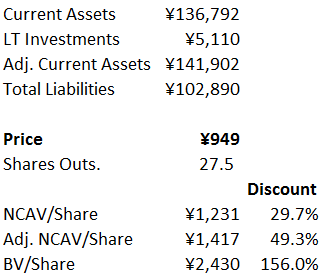
As with the other Japanese stocks I’ve invested in, Mitani is a traditional Graham net-net stock selling for less than NCAV:

Mitani - NCAV Calculation

The company’s enterprise value is negative -¥1,222m, meaning that the market thinks that Mitani’s collection of 100+ subsidiaries is worth less than zero.

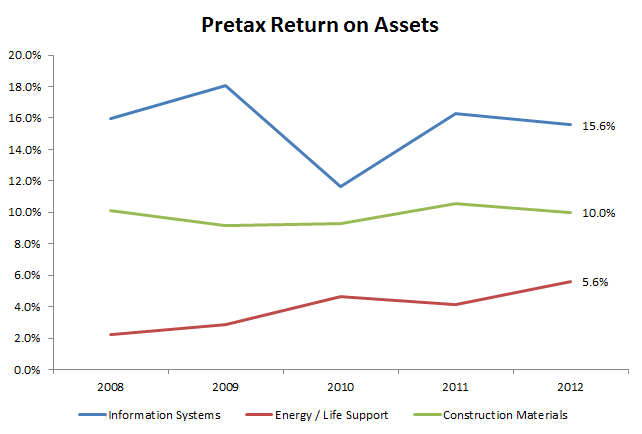
However, the Information Systems and Construction Materials segments are actually good businesses, with double digit pre-tax return on assets[1. Pretax ROA calculated as segment operating profit ÷ total segment assets, without adjustment for inter-segment sales or corporate-level assets.].

Even the Energy & Life Support segment has shown steady improvement:

Mitani - Segment Pretax Return on Assets

Over the past decade, Mitani’s ROE has averaged 8.4%. Since FY2008 (right through a global recession) average ROE actually improved to 8.7% – nothing spectacular, but very good compared to the majority of Japanese net-nets.

At 0.39x of book value, investors are getting a stock that has compounded BV/share by 9.3% annually for 10 years, in addition to offering a 2-3% dividend yield since 2009.

Mitani’s P/B multiple has averaged 0.52x over that time period, with a trough of 0.21x during the depths of the crisis.

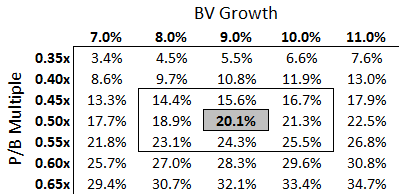
Here are a range of IRR scenarios using BV growth and P/B multiples, starting with the 3/31/12 BV/share of ¥2,429 and forecasting through FY2015:

Mitani - IRR Scenarios

If the stock trades back up near its historical P/B range of 0.5x and continues growing BV/share at 9% per year, the resulting IRR would be 20% per year (or roughly 22.5% with dividends included).

On a P/E basis, Mitani’s multiple has averaged 7.4x over the past decade vs. a current TTM P/E of 4.1x, so a return to long-run averages would imply a price target of ¥1,719, or 81% upside.

Conclusion

Several recent articles have highlighted the potential in Japanese small-caps:

Managers see big profits in Japan’s smaller-caps

Ex-Goldman Trader Run-Symphony Seeks Money for Hedge Funds

This renewed investor interest could lead to more activism in this unloved space.

To conclude, it might be helpful to provide a quick illustration of the potential with many of these Japanese net-nets. Consider:

1. If these activists and hedge fund managers can shake up the situation in Japan (a big if)

2. And market valuations return to more rational levels (probably a bigger if)

…then a growing, consistently profitable business like Mitani should never sell for less than net cash.

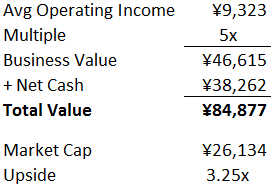
So what might someone bid for the entire company in a private transaction?

Mitani - Business Sale Value

Getting bought out at a “fair” price is wishful thinking given the Japanese environment right now, especially in the small-cap space, but even a return to NCAV within the next few years could offer double digit annual returns.

Disclosure

Long Mitani

CNIM - Financial Overview

Company Overview

Constructions Industrielles De La Mediterranee, or the CNIM Group (EPA:COM), is a French industrial conglomerate which traces its roots back to 1856 – see the full history here.

After a number of acquisitions and division realignments over the years, CNIM has rounded into its current form providing turnkey high-tech industrial solutions in three main areas:

Environment – includes the production and operation of waste-to-energy (WTE) plants, including component parts such as flue gas treatments

Innovation & Systems – includes government contract work (such as missile launch, sea landing, and bridging systems), nuclear parts manufacturing, and industrial research services

Energy – includes solar projects, rehabilitation of water treatment plants, and industrial boiler installation, cleaning, and maintenance

While the overall markets are large, the company goes after specific niches – according to the management team, the strategy is to “Become the leader in a certain number of selected niche markets” – a characteristic of many hidden champions.

This focus is demonstrated by the company’s description of several subsidiaries:

– “In the environmental sector, we are the European leader”

– “Babcock Wanson is European leader in construction of industrial boilers”

– “LAB is European leader in flue gas treatment for waste incineration”

Each business segment is characterized by complex projects requiring high-tech capabilities and engineering know-how.

CNIM is well-suited for the task of leading these niche technological markets, employing over 1200 engineers out of 3000 total workers – human talent is a real advantage when innovating and delivering on these complex projects.

Another hallmark of a business with a competitive advantage is consistent and sustainable returns – over the past ten years, CNIM’s average ROE is nearly 20% despite maintaining a net cash position for the entire period.

Finally, while many projects are won through a one-time bidding process, CNIM also benefits from recurring revenue:

– After construction, many waste-to-energy plants are operated by CNIM for 20-30 years before the company turns the plant over to local governments.

– In the case of CNIM’s Babcock Wanson subsidiary (a key player in industrial boilers and part of the energy division), over 70% of revenues come from recurring service contracts.

The company’s long history and experience in France is reflected by the fact that former French president, Nicolas Sarkozy, gave his 2009 speech on economic recovery at one of CNIM’s sites.

WTE Industry Overview

Although all three business segments provide meaningful revenue, the Environment division provides the bulk of the profit and is what the company is typically known for – a big portion of this segment is focused on the waste-to-energy (WTE) market.

Active in more than 20 countries, CNIM has built over 140 waste treatment plants around the world in places such as Brussels, London, Paris, Turin, New Jersey USA, and Azerbaijan.

Although there is often public outcry from environmentalists and citizens regarding these plants, industry research and scientific studies have backed incineration as a valid method for dealing with municipal waste – it is also classified as a renewable energy source.

According to the company’s reports, waste incineration is

“…by a long way the cleanest, most efficient and most tightly-controlled industry in Europe, with extremely well monitored residual emissions whose effects on health and the environment in general are recognised as negligible”

Although recycling is still the preferred method for waste management, as much as 60% of municipal waste cannot be recycled or reused in a valid way.

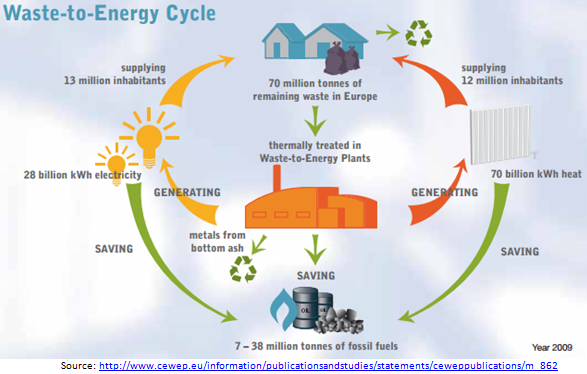
Here is an infographic that explains the waste-to-energy cycle:

CNIM - Waste to Energy Cycle

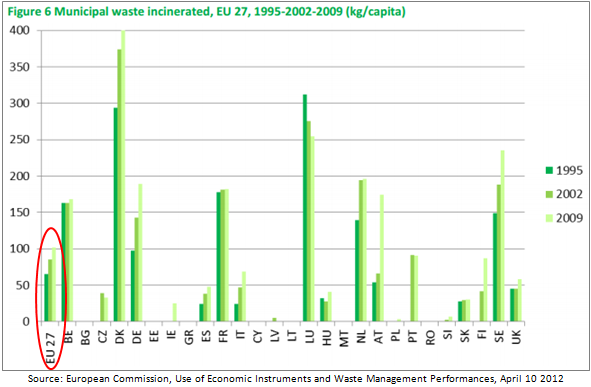
Across the EU27, over 400 such waste-to-energy plants are currently operating (implying a market share for CNIM of 30-35%) – these plants incinerate approximately 22% of total municipal waste and the volume of waste incineration is rising:

CNIM - Municipal Waste Incinerated

However, many countries within the EU27 still have little or no incineration plants, an untapped market for CNIM – one study has the WTE technologies market growing from $6.2B to $29.2B by 2022, or 17% per year.

CNIM’s leadership position in this market was validated in 2010, when the company was recognized as an official partner of the EU’s “Sustainable Energy Europe” campaign for its work in constructing six new energy-to-waste projects.

Investment Thesis

1) Record backlog and book-to-bill ratio points towards continued revenue growth in 2012, while shift in sales mix towards higher margin Environment business will boost profits

At the end of 2011, CNIM’s backlog stood at €1,151m, the highest end of year backlog in the company’s history and a 30% jump over 2010.

CNIM - Backlog

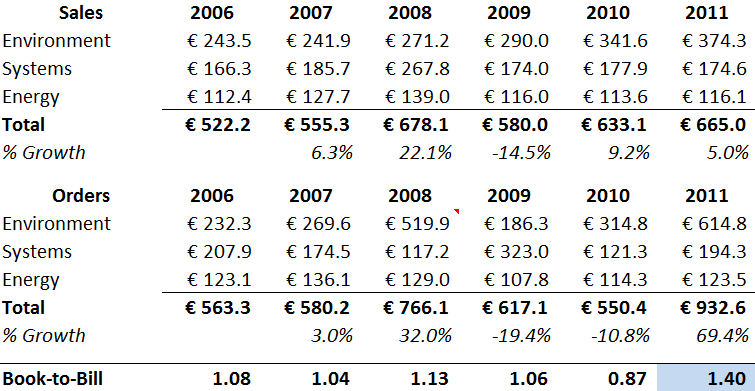
While backlog grew 30%, sales were up only 5%.

Assuming the company can successfully handle the additional business, this divergence in growth rates for sales vs. backlog represents significant revenue potential for CNIM through 2012 and 2013:

CNIM - Sales & Orders

At the end of 2011, CNIM’s book-to-bill ratio was 1.4, 35% higher than the company’s long-term average of 1.04, once again signaling pent-up demand.

Based on Q1 2012 numbers released in May, the strong flow of orders has continued, with backlog rising to a new record of €1290m, 58% higher than the average backlog from 2006-2010.

Although the market is worried about CNIM’s exposure to Europe, these order numbers should lead to significant revenue growth over the coming year or two.

In addition, a closer examination of the backlog mix points towards a shift towards higher margin business lines.

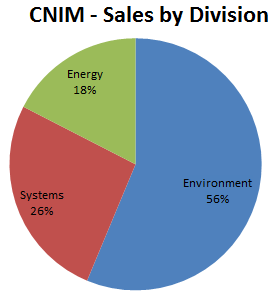
Here is a breakdown of the company’s sales in 2011:

CNIM - Sales by Division

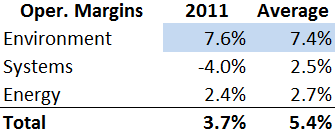
Although Environment business made up 56% of 2011 sales, it represented 71% of total backlog at the end of Q1 2012. Importantly, this division has margins that are almost 3x higher than the other two segments:

CNIM - Operating Margins

This percentage shift should push up the company’s overall margin, resulting in increased operational leverage and improved EPS as revenues rise in 2012-2013.

2) Discontinued operations have obscured the company’s true earnings power, causing the stock to be overlooked by casual investors

In 2009, the company went through a mini restructuring in response to a €7.8m operating loss.

The supervisory board fired the old management team and decided to divest the Transport business (a maker of heavy duty escalators), a segment which had lost money in the previous three years.

Since the decision to sell, the company has managed to liquidate, transfer, or sell a number of the units within the Transport division, but the process has dragged on (the segment had included 9-10 separate companies/subsidiaries, representing over €100m in sales).

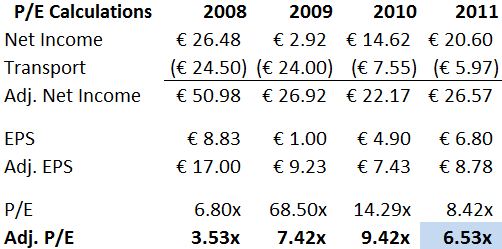
While the Transport division was classified as discontinued operations going back to 2008, a quick glance at the bottom-line earnings number without adjusting for this fact shows a markedly different picture of the company’s valuation:

CNIM - EPS Calculations

While some websites display the adjusted figure, others show a P/E in the 8-9x range, which could cause investors to overlook the stock while using basic screening methods.

3) CNIM’s contract-based and complicated business creates lumpy cash flow figures, despite an attractive double digit FCF yield based on normalized or average figures

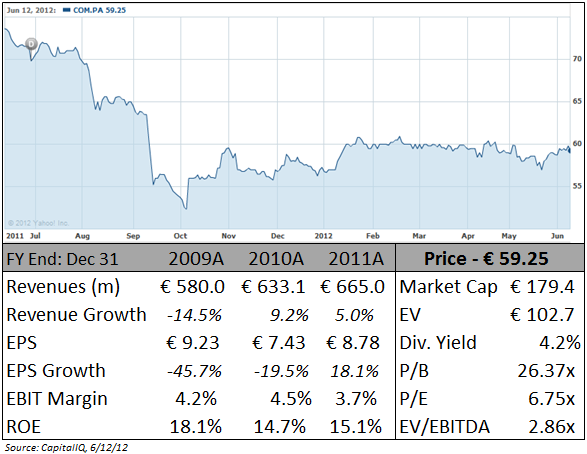
In 2011, CNIM reported €52m in operating cash flow offset by €10.7m in capital expenditures, which translated into €41.3m in FCF. With a market cap of €179m, that equates to a FCF yield of 23%.

However, CNIM’s working capital and operating cash flow can shift dramatically from one period to another, depending on the timing and collection of payment for its projects.

For example, a single large order (such as the €346m order to build a waste incineration plant in Azerbaijan in 2008) can cause dramatic swings in the company’s working capital.

Therefore, it is helpful to look at the average cash flow generation of the business over a longer time period.

While CNIM is not a high growth company, capex has outstripped D&A over the past ten years, implying that management has invested back into growth opportunities – an estimate of maintenance capex results in an even lower figure:[1. Maintenance capex was calculated using the Greenwald method of estimating growth capex based on % of PP&E necessary to support revenue growth. See explanation here ] 

CNIM - Capex Calculations

The impact of the Transport division has also affected the company’s cash flow figures – over the past three years, the company has spent €38.1m in cash on discontinued operations:

CNIM - FCF Calculations

Average FCF yield ranges from 8.4% to 25% depending on whether a market cap or EV-based denominator is used – all but the most conservative combination clears a 10% hurdle rate:

CNIM - FCF Yield

Given the current rate environment, any of these FCF yield scenarios is attractive.

4) Business/management has impressive track record of creating value, while the depressed valuation due to Euro crisis presents a buying point far below long-term averages

In the past ten years, CNIM’s management team has been able to growth BV/share from €26.30 to €58.50, for a CAGR of 9.3%.

While this number is good given the time period, it is even more impressive considering the company has paid a large dividend (averaging 40% of total earnings) for a dividend yield of 4-5%.

Looking at it another way: starting from a BV/share of €26.30 in 2002, CNIM paid out dividends/share of €26.00 over the next ten years.

Hypothetically, if an investor picked up shares at BV/share of €26.30, collected the interim dividend payments, and then sold out at the 2011 BV/share of €58.54, the resulting IRR would have been 17% over ten years.

While this exercise shows how management has created value, it is only hypothetical, as the stock price was actually flat from 2002-2011 due to a contraction in the stock’s P/B ratio.

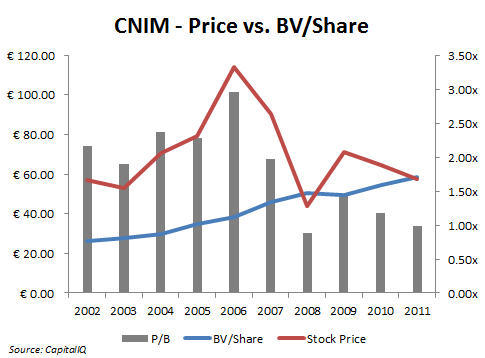
Here is a chart showing the stock price, book value per share, and P/B ratio at the end of each of the past ten years:

CNIM - Price vs BV Share

Despite improving operating results and a steady growth in book value per share, the stock price has been volatile and has not recovered much from the recession lows – the P/B ratio continues to hover around 1x.

At near book value, an investor is picking up a business that has earned an average ROE of 20% over the past ten years, for an implied future return of almost 19%.

Valuation

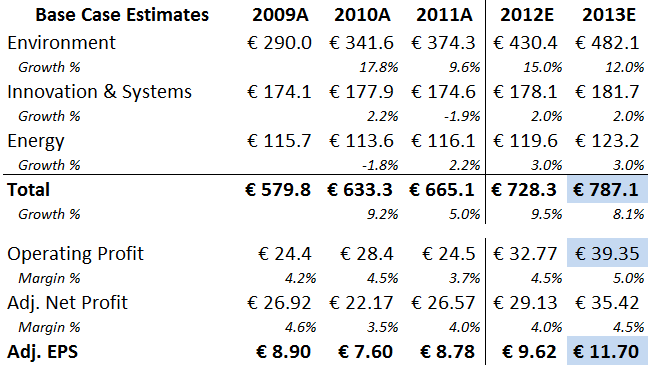
CNIM - Base Case Estimates

In the base case scenario, CNIM generates almost €800m in revenue, operating income of nearly €40m, and EPS of almost €12.00 by 2013.

Assigning a 10x multiple (below the LT P/E multiple of 12x) on this forecasted 2013 EPS would result in a per share price of €117, or 97% upside.

In addition, with the inclusion of expected dividends, the 2-year IRR would be 49% per year.[2. Assumes collection of FY2011, FY2012, & FY2013 dividends. Ex-dividend date for FY2011 is June 29, 2012]

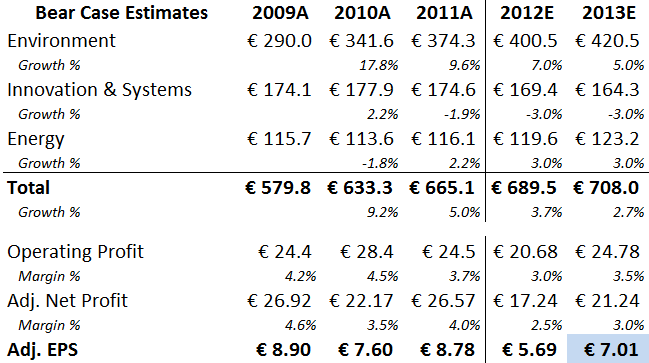
In a bear case, the backlog does not translate into the corresponding sales growth, margins compress further due to project cutbacks, competition, and discontinuation of defense programs, while the P/E multiple stays at its depressed level of 7x:

CNIM - Bear Case Estimates

Even in this extreme example, the share price falls to €49.10, but with dividends included the two-year IRR is still 1.2%, or basically breakeven.

With the company reporting sustained growth in orders and backlog, the likelihood of this scenario seems remote.

More simply, if the stock just returns to trading near its historical averages, the upside is substantial:

CNIM - Valuation Metrics

Risks

1) Growth via acquisition creates risk – CNIM has made a number of acquisitions over the years, and intangibles make up roughly 30% of total equity. Most of the recent acquisitions were small however, and goodwill impairments were negligible even during the depths of the recession.

In 2008, CNIM purchased the Bertin Group for €17.2m (€7.1m in goodwill) – the next year, Bertin had sales of €47m and net income of €5.9m, implying a transaction value of only 3x NTM earnings, a good deal.

2) Uncertainty over new French president – Reform policies by the new president of France, François Hollande, could affect CNIM’s businesses, especially in the Innovation & Systems division, which is tied to government spending and defense contracts.

Hollande has pledged to reduce the budget deficit to zero by 2017, which could entail defense cuts. On the other side, he has also pledged to reduce French dependence on nuclear power in favor of renewable resources, which would boost CNIM’s waste-to-energy business.

3) Family-owned stock with small float – CNIM is a closely-held company with only 29% of shares available to the public. Therefore, liquidity and common shareholder representation could be a concern.

37% of shares are held by the Herlicq and Dmitrieff families, who have family members represented throughout the management team and supervisory board, and have long histories with the company.

Conclusion

Barring a complete and catastrophic meltdown in Europe, the markets are providing an opportunity to pick up a well-run business well below its valuation averages – and near lows not seen since the depths of the 2008/2009 recession.

Not only are investors receiving a double digit FCF yield and a healthy dividend payout, but if the growing backlog translates to the anticipated sales/earnings growth, CNIM should provide an attractive IRR over the next several years.

Disclosure

Long CNIM