As I’m now entering the fourth module of my 1st year in business school, I’m starting to get into some of my elective classes for investment management.
So far, it has been a lot of academic-focused lessons on efficient markets, betas, CAPM, and factor models…not exactly topics that mesh with trying to outperform the markets by picking undervalued stocks!
Even so, it has been helpful to understand the viewpoint of academic finance. Even if I do disagree with most of it, I can appreciate the process behind many of the studies.
In fact, the best part so far has been having access to massive amounts of quality financial data and academic research.
I thought I would include a few of the more interesting charts and graphs from the year so far.
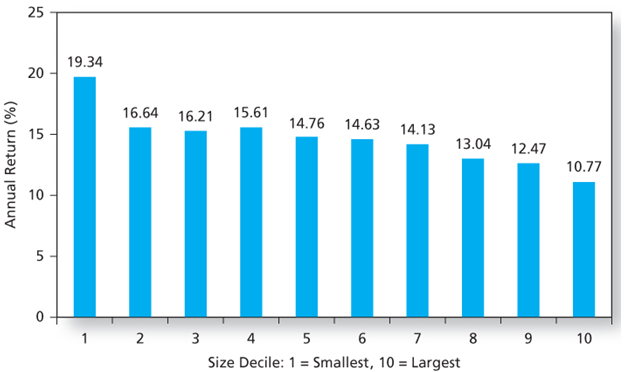
Returns on Small vs. Big
Source: Professor Ken French’s Data, 1926-2008
Confirmation that small stocks outperform larger ones (and validation for the small-cap focused nature of this blog).
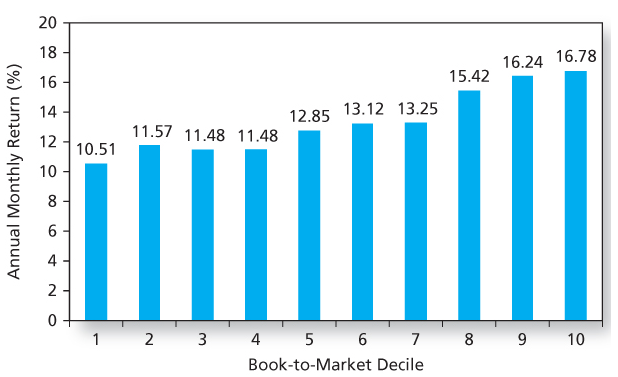
Returns on Value vs. Growth
Source: Professor Ken French’s Data, 1926-2008
And that value stocks outperform growth (high market-to-book = low P/B stocks):
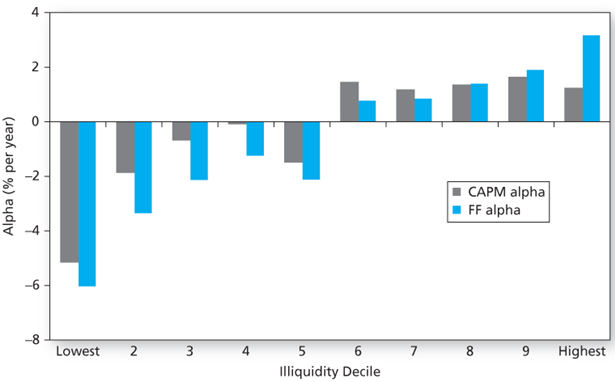
Returns by Liquidity
Source: J. Liew and M. Vassalou, “Can Book-to-Market, Size and Momentum Be Risk Factors That Predict Economic Growth?”
Illiquidity can also be a factor in producing above-average returns. This chart shows the alpha generated by stocks across the liquidity range, above and beyond what is predicted by CAPM and the Fama-French 3-factor model.
Whether or not CAPM or the FF-model does a good job of predicting returns is another debate (they really don’t).
However, if an investor is patient, a willingness to tie up capital for an extended period (hopefully in an undervalued security) could yield above-average results.
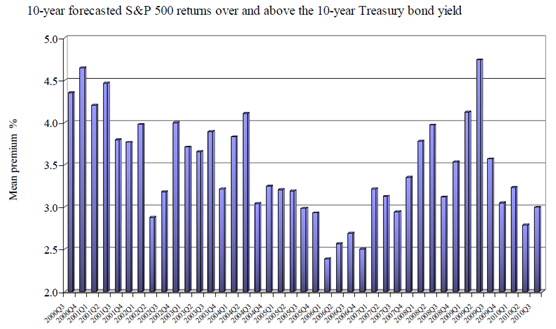
Risk Premiums
Source: John R. Graham & Campbell R. Harvey, “The Equity Risk Premium in 2010”
This chart is pulled from a forecast of CFOs on the equity risk premium used in cost of capital calculations.
An initial look at the graph shows that premiums are extremely volatile, which further weakens the validity of a CAPM model.
Interestingly, the reported risk premium hit a low in 2006/2007, just before the bubble popped (and when most stocks were overpriced).
On the other hand, CFOs demanded a much higher premium (and therefore thought future projects were riskier) in the early part of 2009, right when investors should have been buying.
Could a low risk premium be an indicator for poor stock market performance?
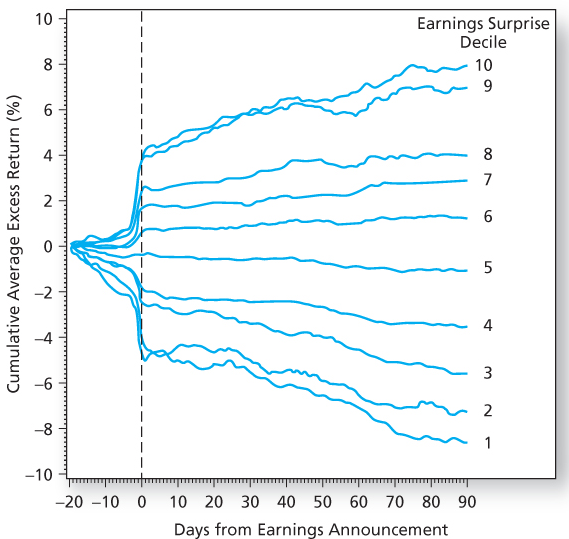
Earnings Surprises
Source: R.J. Rendleman Jr., C. P. Jones, and H. A. Latane, “Empirical Anomalies Based on Unexpected Earnings and the Importance of Risk Adjustments”
Many short-term focused hedge funds play an earnings game, and it turns out that there is some interesting effects, especially after large earnings surprises.
Efficient market proponents would argue that the market immediately adjusts to reflect the new earnings picture after an unexpected quarter, but studies have shown that earnings continue to drift for several months.
A possible takeaway: If a stock reports a surprisingly bad quarter which changes the fundamental thesis about the company, it’s better to sell right away vs. trying to time a better exit point in the future.
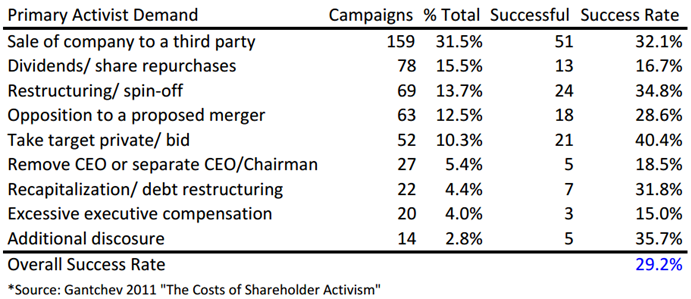
Activists
Despite some very high-profile activist campaigns, only 29% actually succeed. It’s no surprise that lowering compensation and removing a management team have a below-average success rate.
As a microcap investor, going private transactions have been a key source of unlocking value, and the success rate probably reflects the fact that management is often on board in these transactions.
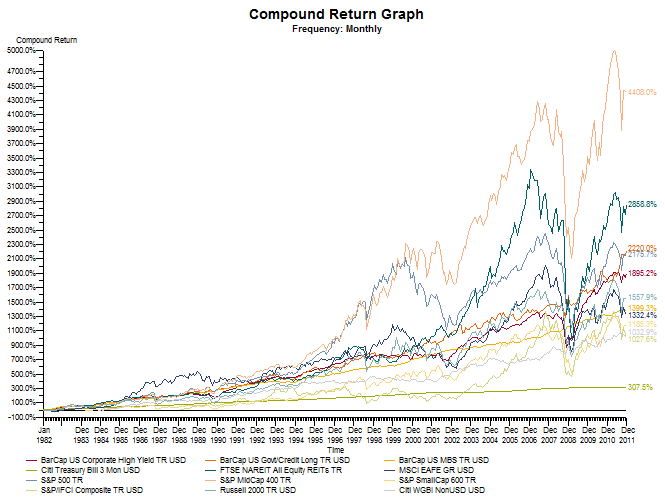
Asset Class Returns
Access to high quality financial data allows a study of asset class returns over long time periods.
In this chart, the dip in 2008/2009 is clearly shown across almost every single asset class.
In fact, correlations between asset classes tend to increase significantly during high volatility periods, just at the time when diversification is supposed to provide the greatest benefits.
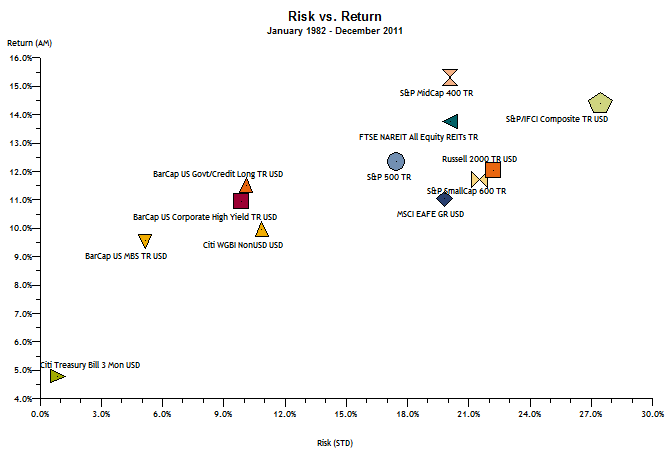
1982 – 2011
Look at the risk-reward of midcaps over the past 20 years…a possible underinvested asset class?
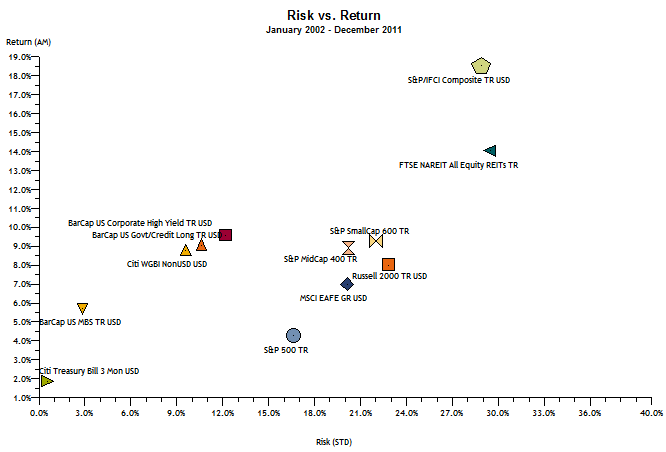
2002 – 2011
Over the past 10 years, stocks have performed poorly, as bonds returned nearly the same amount with much lower risk.
Final Thoughts
This post was a bit outside of my normal zone, so please let me know if you found this post interesting and/or worthwhile, and I’ll plan on collecting similar information going forward.
I’m also the getting involved in Kenan-Flagler’s student-run investment fund, which provides the opportunity to manage roughly $2m across a wide range of asset classes.
As the new Equities Manager, I’m responsible for the stock investments, so I’m looking forward to getting some practical experience over the next year – more stock pitches to follow!

