Pinnacle Gas Resources (PINN) is a micro-cap stock that holds natural gas properties in the Powder River Basin of Wyoming and Montana. The company leases approx. 406k gross acres of undeveloped land and 15 billion cubic feet (bcf) of proven natural gas reserves.

The company has reported large operating losses for the past three years, with 2009 being especially brutal. PINN reported a net loss of $68.75m as natural gas prices dropped significantly, from an average of $6.24/Mcf in 2008 to only $3.07/Mcf in 2009.

Strategic Going Private Transaction

On February 24, 2010, Pinnacle announced a going private transaction led by Scotia Waterous, the oil & gas M&A division of Scotia Capital. From the press release,

“The Special Committee considered a range of potential alternatives, including continuing to operate as an independent entity, possible sales of certain assets, the Company’s ability to issue additional equity in a public or private offering, and restructurings of the Company’s outstanding debt”

According to the board, this transaction was the best alternative for company shareholders.

Agreement Terms

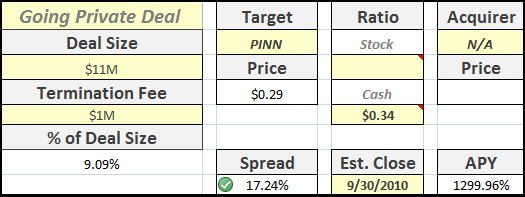
The going private deal is a $0.34/shr cash offer, valuing the company at $11m. The merger required shareholder approval and the waiver of certain lending conditions of Pinnacle’s credit facility.

Under the merger agreement, shareholder approval had two parts: 1) a majority vote of all shares & 2) a majority vote of all shares not owned by DLJ Merchant Banking Partners III (DLJ) and the company’s senior executives.

On August 11 2010, PINN’s shareholders voted to approve the merger, with 72.6% voting in favor.

Credit Agreement Default

The last condition for the completion of the transaction is a waiver by the company’s senior lender, the Royal Bank of Scotland.

Pinnacle borrowed heavily in 2007 – the drop in gas prices and the poor performance of the business forced severe restrictions on the company’s credit facility.

The credit agreement was modified a total of 7 times on the $5.1m balance.

According to the latest revision, the Final Maturity Date was set at

“(i) June 15, 2010 or (ii) the date that is thirty days following the earlier of (A) the date the merger is withdrawn or terminated in whole or in part or (B) the date that the lenders have been advised that the merger will not proceed.”

The company missed payments on both July 1 and Aug 1, effectively breaching the agreement not only with the lender, but with Scotia Waterous as well.

However,

“Scotia has indicated at this time that it will not waive the default; however, it has not terminated the Merger. Accordingly, the Company and Scotia are proceeding with the Merger”

There has been no further info since the August 16 quarterly filing.

Risks

This is a tiny transaction, and there were several lawsuits (since settled) surrounding the management team and their relationship to the acquirer both pre and post merger.

Typically, these types of transactions close very quickly after shareholder approval, but the deal has been languishing for almost a month.

If Pinnacle does not receive a waiver from its lender, the full $5.1M becomes immediately due – since most of the company’s assets are tied up in natural gas (under the ground!), this would most likely force the company into bankruptcy.

Valuation

Pinnacle Going Private Transaction

The stock dropped over 10% towards the end of the day on no news and slightly above average volume – amazingly, $0.29 has been the lowest price since the merger was announced over 6 months ago.

Conclusion

The drop in price at the close today is a very suspicious indicator, possibly indicating that the market does not believe that the company’s lender will give the go ahead.

Although the spread is very attractive, the downside risk is basically bankruptcy.

So, is the deal worth the risks? Any reason why the RBS would refuse a final waiver after such a long road?

Disclosure

No positions.

As I’ve analyzed on Value Uncovered before with the UBET/CHDN deal, merger arbitrage (along with other special situations investments like going private transactions and tender offers) can provide solid returns during periods of market uncertainty.

Over the past several months, I’ve kept my eye on a merger opportunity between two small community banks in Pennsylvania, Tower Bankcorp (TOBC) and First Chester County Corporation (FCEC).

If structured correctly, these special situations investments can provide ‘risk-free’ profits, but investors must read the deal terms very closely or find their ‘risk-free’ position is exposed or incorrect.

Merger Background

On December 12, 2009, Tower Bankcorp, a community bank with a market cap of 134M, agreed to purchase First Chester National Bank with an all-stock transaction valued at $65M.

The stock transaction was structured using a floating exchange ratio based on FCEC’s performance until closing – at announcement, the deal was valued at $10.22 per FCEC share.

Together, the two banks would have a combined size of $2.7B in assets, with a strong presence in key markets around Philadelphia and Harrisburg, PA.

As originally planned, the merger was supposed to close in Q2 2010, subject to the necessary shareholder and regulatory approvals.

Merger Complications

During the second and third quarter of 2009, FCEC suffered from a sharp increase in the number of impaired loans, with non-performing loans jumping to 2.84% in Q3 2009.

Two days after the merger announcement, FCEC sold $52.5M in residential loans to TOBC in order to ensure the bank complied with minimum regulatory capital requirements.

Also, as part of an amendment to the merger agreement in early March, FCEC agreed to sell off its American Home Bank mortgage division, with TOBC provided a $2M line of credit as needed, once again to stay above capital requirements.

To further complicate matters, after a review by the bank’s audit committee in early March, FCEC found material weaknesses in its internal control procedures for identifying problem loans, forcing the bank to restate financials for all of 2009.

Finally, due to First Chester’s inability to file reports in a timely fashion, the NASDAQ put the stock on notice of delisting.

These complications pushed out the timeframe for closing the deal, and caused further uncertainty in the markets on whether the transaction would be finalized at all.

On the Road to Recovery

Despite the struggles at FCEC during the first quarter, the banks seemed to have made significant strides towards completing the merger:

May 24 – The banks received a first round of regulatory approvals from the FDIC and PA Department of Banking.

June 30 – Federal Reserve of Philadelphia approves the transaction, satisfying all regulatory requirements

July 27 – FCEC files restated quarterly reports for 2009, along with its annual 10-K

August 11 – FCEC catches up on its quarterly report for Q1 2010

August 18 – FCEC files a quarterly report for Q2 2010, announcing that the bank’s financials are up-to-date

Terms of the Merger Agreement

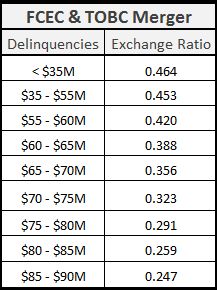
According to the merger announcement, the shareholders of First Chester would receive 0.453 shares of TOBC stock for each share of FCEC. The exchange ratio was variable, using the following table:

FCEC_TOBC Merger - Exchange Ratio

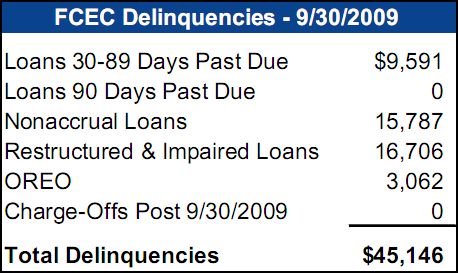
Delinquencies were calculated for purposes of the merger as follows:

FCEC Delinquencies 09/30/2009

Inflated Exchange Ratio?

At first glance, the merger had a ridiculously high spread, leading to more investigation for a possible arbitrage opportunity.

As recently as two weeks ago, FCEC stock was trading over $8. With TOBC trading around $19, the market was implying an exchange ratio of approx. 0.420, signifying delinquencies in the $55 – $60M range.

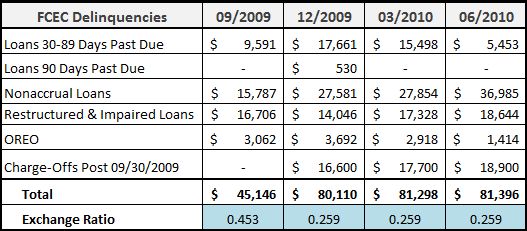
After digging through FCEC’s latest 10-Q, as well as detail from the bank’s FDIC call reports, my calculations show a different scenario:

FCEC Quarterly Delinquencies Analysis

Apparently, other savvy investors have caught on, as FCEC’s stock price has fallen almost 35% in the last month, with a sharp drop occurring this past week.

However, even with the lower prices and revised exchange ratio, the stocks still appear to be mispriced:

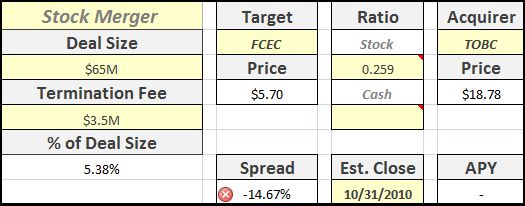
FCEC_TOBC Merger Spread Analysis

A purchase of FCEC’s shares will result in a loss of almost 15% post-merger (assuming no change in the stock price of TOBC), a significant difference.

Additional Risks

Outside of the exchange ratio issues, there remains significant hurdles to the completion of the deal.  The transaction must still be approved by the bank’s shareholders – at current pricing levels, it would seem illogical for FCEC’s shareholders to approve the deal.

FCEC also announced that the outside date of the merger would be revised to November 20, 2010, potentially pushing out the completion even further.

Conclusion

As I mentioned at the beginning of this post, merger arbitrage can offer attractive annualized returns, but there remains definite risk for investors who aren’t diligent in their analysis.

In this case, a too-good-to-be-true return scenario led to a need for further digging, and revealed a transaction that the market continues to misprice.

*Hat tip to Cale Smith over at Islamorada Investment Management for sparking the discussion. And stealing my limelight with his post! 🙂

Disclosure

No positions at the time of this writing.

In recent posts, I’ve written about the disappearing abnormal returns for additions to the S&P Index and the significant outperformance of S&P deletions after the effective date.

To finish off the series, I’d like to catch up with several recent developments around these trading strategies and examine if the same abnormalities would hold for other indexes as well (namely the Russell 2000 Index).

But first, I’d like to point out some changes related to the S&P indexes…

S&P Discontinues Announcements

Standard & Poors posts news and announcements regarding the various indexes on their website.

Each announcement can be saved as a .pdf file, but the website does not provide an RSS feed for staying up to date.

During the research for my previous posts, I was able to sign up for S&P’s email list in order to receive timely announcements regarding additions and deletions, without having to check the website each day.

Sadly, I received an email on August 3rd announcing that Standard & Poors will be discontinuing their email list:

“S&P is implementing a new policy that will affect email alert communications in relation to index announcements and other index-related matters. Effective August 13, 2010, S&P will provide email alert communications only to subscribers.”

Unfortunately, subscription is not cheap.

Recent Additions

Since my original post, Standard & Poors has announced several changes to the indexes.

On July 8, S&P announced that ACE would replace MIL in the S&P 500 index on July 14.

Results:

  • Price on AD + 1 – $54.69
  • Price on ED – $55.88
  • Outperformance – 0.81%

In addition, two other stocks were added to the S&P Smallcap 600 index on July 8 (ODSY & SXE) for those who would like to continue following this strategy.

Recent Deletions

On June 23, S&P announced that MAG would be replaced by FSS in the S&P Smallcap 600 index due to market cap considerations.

Results:

  • Price on ED – $0.92
  • Price on ED +20 – $1.09
  • Outperformance – 12.22%

The deletions strategy continues to outperform.

Russell Index

reader comment asked whether the trading strategies detailed in my original posts would also apply to the Russell 2000 index.

While the S&P 500 index is widely used as the “benchmark” for large-cap mutual funds, many small-cap funds compare their returns to the Russell 2000, the bottom 2000 stocks in the Russell 3000 Index.

Russell Reconstitution

As opposed to the S&P index – where stocks are picked subjectively by committee on an as-needed basis throughout the year – stocks are added to the Russell Index using strict rules based on market capitalization.

Rather than replacing stocks throughout the year, the Russell Index is rebalanced once a year during the month of June – an event known as reconstitution – with a preliminary list of additions and deletions announced two weeks in advance.

In 2010, a preliminary list of stocks was announced on June 11, with an official reconstitution date of June 25.

Just like the S&P effect, index funds following the Russell 2000 are required to closely match the index returns – meaning managers must buy and sell indiscriminately around the reconstitution date.

Returns

Academic studies have shown stocks added or deleted to the Russell 2000 show statistically significant returns during the reconstitution period.

In 2010, there were 333 additions and 219 deletions. I calculated average returns below.

Results:

  • Additions: 1.23%
  • Deletions: -1.90%

This compares to a loss of -0.36% to the underlying index.

Conclusion

Based on these results, there seems to be an opportunity for investors to profit from this annual re-balancing.

However, there are certainly challenges:

  • The sheer volume of changes could make a profitable trading strategy hard to implement.
  • Differences between the preliminary and final list could leave investors holding stocks that did not make the final cut.
  • Several changes to the reconstitution method – including market cap banding and adding IPO stocks on a quarterly basis – have decreased the abnormal returns.

Even with these considerations, there is evidence that the Russell 2000, just like the S&P indexes, experiences an index effect that drags on investment returns.

One study (co-authored by Vijay Singal, the author and inspiration for my previous posts) found that the Russell 2000:

“underperformed other small-cap indexes by more than 3 percentage points a year in the 1995-2002 period, even though comparable indexes did not entail more risk.”

Disclosure

No position in any of these stock at the time of this writing.