After 3 years and over $35m in losses, Sparton Corp (SPA) took a giant leap forward in 2010, evidence of a strong turnaround by the new management team.

SPA struggled through several bad years due to a variety of causes: underutilized and unused manufacturing facilities, lax management, inflexible long-term contracts and overall recessionary pressure.

Despite these difficulties, the underlying business had potential, and based on latest results, the stock remains undervalued with strong potential for future growth.

Background

Sparton operated at only 25% of operating capacity for period of time after management decided to move business to an inefficient facility in Jackson, MI (where the company HQ’s and management were located), instead of keeping it at a modern facility in New Mexico.

In addition, quality concerns led to substantial losses within the DSS segment as Sparton was forced to eat the losses on fixed price contracts.

Finally, in mid-2008, the company’s largest shareholder, Lawndale Capital Management, initiated a proxy fight citing concerns regarding Sparton’s corporate governance and board composition – new directors were nominated, along with a recommendation for hiring an experienced turnaround management team to shakeup the long-entrenched and underperforming management group.

Soon after, a rockstar turnaround team was put into place, starting with the hiring of a new CEO, Cary Wood, in November 2008.

The new team instituted a number of initiatives for controlling costs during a tough business climate and setting the strategic vision for the company’s future, including:

  • Cutting staff by 6% during the course of 2009
  • Freezing pension plan accruals and 401(k) matching contributions
  • Closing several plant facilities and consolidating others
  • Initiating lean manufacturing principles throughout the company’s locations
  • Eliminating unprofitable long-term contracts
  • Setting long-term growth strategy, including identifying core business segments

These changes were necessary and significant step in the right direction.

Business Segments

Management also consolidated and organized the business into three segments:

Medical Device Operations – contract design and development for complex electromechanical devices for medical device customers

Electronic Manufacturing Services (EMS) – contract manufacturing and prototyping for industrial customers seeking quality-assured products such as flight control systems, security systems, lighting, and defense

Defense & Security Systems (DSS) – design and production of defense programs, focused on sonobuoys, an anti-submarine warfare (“ASW”) device used by the U.S. Navy and foreign governments. NoteSonobuoys are consumable devices with a life of less than 8 hours and the Navy requires a constant supply – Sparton is one out of only two companies capable of manufacturing these products.

Financials

For fiscal 2010, total sales were down 22% to $173.98m, as the company walked away from unprofitable contracts with several major customers, primarily within the EMS segment.

Despite the sales decrease, the company blew out its income targets, turning in four straight profitable quarters after reporting pre-tax losses for the previous twelve. Overall, net income jumped to $7.44m compared to a loss of $15.75m in 2009.

These results were more than double management’s incentive goals, as the business returned to profitability significantly ahead of schedule.

Further, these results were accomplished despite continued restructuring expenses in 2010 ($4.1m compared to $7m in 2009). The good news is that all restructuring activities appear to have been completed as of June 2010.

Gross margins averaged 15.9% in 2010 with encouraging improvements in all three business segments. Operating margins are tight (3.3%) but should continue to rise.

In fact, the company’s EMS segment reported an operating loss in 2010, with a terrible fourth quarter. However, management raised its margin guidance for this segment going into 2011, a positive sign for the segment’s prospects.

CROIC (14.8%) and ROE (11.6%) are both solid and should increase as well.

As part of the turnaround plan, Sparton aggressively paid down debt, reducing it from $22.96m in June 2009 to only $1.92m a year later.

In addition to producing solid free cash flow ($7.9m), the company also has an unused $20m credit facility, and over $30m in cash on the balance sheet (with another $3.2m in restricted cash about to be released).

Once the restricted cash is released, the company will be have almost $33m in net cash, giving the stock an EV of under $40m.

Catalysts

Uninhibited Growth

Even with the stellar results, the company still has room for improvement – an easy change will be the reporting of clean operating results going forward in 2011.

Restructuring/impairment charges and other operating expenses (related to carrying costs for facilities – now sold) added up to $5.78m, offset by $3.12m in gains from the disposition of these assets.

Removing these expenses will add almost $0.27 per share to 2011 results.

In addition, SPA announced the resumption in marketing programs, an area neglected for several years:

“in the near term, a new marketing initiative will center around identifying our brand and brand position, developing new selling collateral materials, enhancing our trade show image and presence, and modernizing Sparton’s website architecture and technology – all done with a level of professionalism that will fully support and improve the selling effort.”

Finally, Sparton is also recommitting itself to R&D activities around creating proprietary product lines within the DSS segment, a potential (and high margin) boost to future profits.

Smart Acquisitions

In August, Sparton announced the acquisition of the contract manufacturing business of Delphi Medical Systems for $8m.

The acquisition is expected to add $32m in additional revenue. Delphi has two manufacturing facilities that could eventually be consolidated, and management believes that margins could be improved a similar range to corporate (13-15%).

Since the purchase also covers Delphi’s inventory, the acquisition is a steal, and will allow SPA to broaden its reach into the Western U.S.

Investor Roadshow

Despite the turnaround, many investors are still unaware of this micro-cap stock.

Management appears to be attacking this situation by going on the road – with investor presentations scheduled in Minneapolis (Oct), Dallas (Nov), Connecticut & Baltimore (Dec), along with stops in California, New York, and Philadelphia.

Sparton’s corporate presentation presents a compelling story, and the market should react favorably to the stock’s potential.

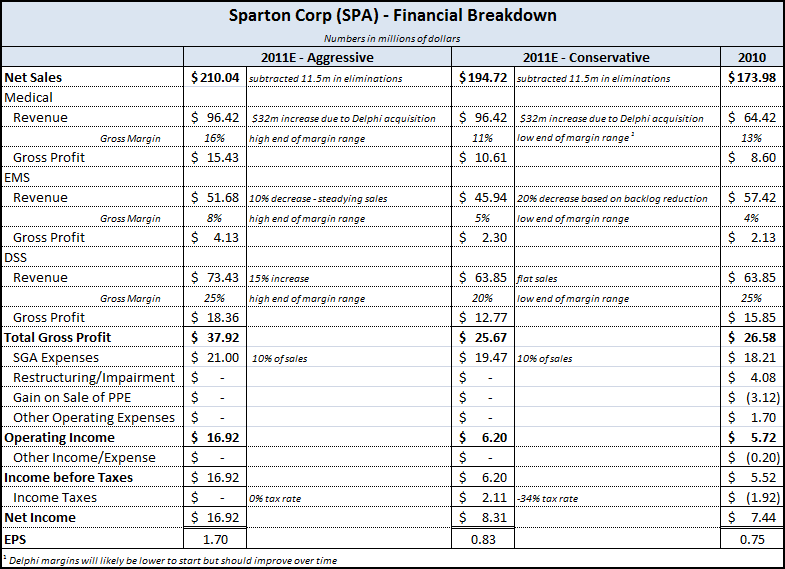
2011 Estimates

SPA - Financial Breakdown 2010-2011

Using the average of these two estimates, and my forecasted EPS for 2011 comes in at $1.27/shr.

Valuation

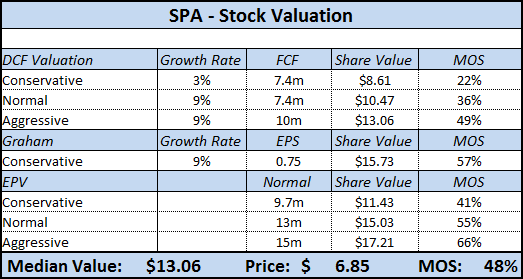
SPA - Stock Valuation

The current EV/EBIT ratio is 6.5 – very cheap for a profitable and growing company.

SPA’s current P/E ratio is 9.18. While it is hard to find a close competitor, SPA’s industry has an average P/E ratio of 16.

Applying this P/E multiple to the current share price and EPS numbers yields a target value of $12.

Using this same multiple but a 2011 estimated EPS of $1.27 would imply a per share price of $20.

Conclusion

Cary Wood and the rest of the management team have done an incredible job of focusing the company and recovering from a string of bad years – it is a true turnaround story with plenty of opportunity going forward.

The Delphi acquisition should be immediately accretive, and Sparton will continue to drive profitability by improving margins across the business units.

Conservatively, the stock should return 50%+ over the next year or two.

Building on 111 years of history, Sparton Corp has big plans:

“Sparton will become a $500 million enterprise by fiscal 2015 by attaining key market positions in our primary lines of business and through complementary and compatible acquisitions; and will consistently rank in the top half of our peer group in return on shareholder equity and return on assets.”

It’s an audacious goal, but one that will richly reward shareholders who are along for the ride.

I’m adding SPA to the Value Uncovered portfolio at today’s closing price of $6.85.

Disclosure

Long SPA

The recreational vehicle (R/V) market was absolutely crushed during the recession of 2008 and 2009, as customers put off major discretionary items.

Coastal Distribution System (CRV), a part maker and distributor of over 12,000 RV and boating parts, supplies and accessories, was hit especially hard, with sales dropping more than 40% between 2006-2009.

Despite the company’s struggles, the industry appears to have hit rock bottom and the future outlook has started to show signs of improvement.

While CRV probably won’t see 2006 levels anytime soon, the stock should rally as the company and industry ‘revert back to the mean.’

Financials

2009 revenues were $103.2m, well off the peak of $179.1m in 2006. However, the company has managed to streamline operations during that time period.

In 2009, management’s cost cutting measures reduced SGA expenses by $8m, or 30.2%, over 2008.

Gross margins have remained steady throughout the downturn, around 18-19%, with a slight uptick as the company moves towards self-designed products (for the most recent quarter, approx. 33% of sales were from Coast’s own brand).

Both operating and net margins are extremely tight, averaging 2.6% and 0.9% over the past five years.

Quarterly Results

Through the first six months of the year, revenues were up an encouraging 4.3%, but with an even stronger improvement on the bottom line.

Operating income jumped 141.8% compared to the same period last year, as the company even managed to squeeze out a slight profit in the 1st quarter (usually the seasonal low period for R/V sales).

FCF so far in 2010 has been $1.2m, a big improvement over 2007-2009 (average of $0.43m), but still a ways off from 2003-2006 (average of $3.4m)

Industry Trends

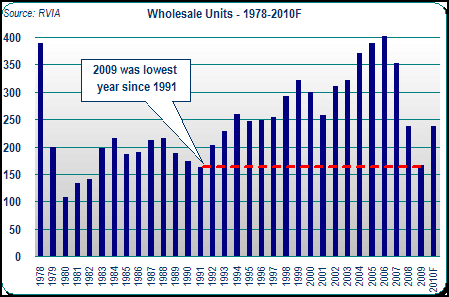
RV Wholesale Unit Sales - 1978-2010F

As the chart shows, R/V sales took a dramatic dive during the recession to a low of 165.4k units in 2009, a level last seen in 1991.

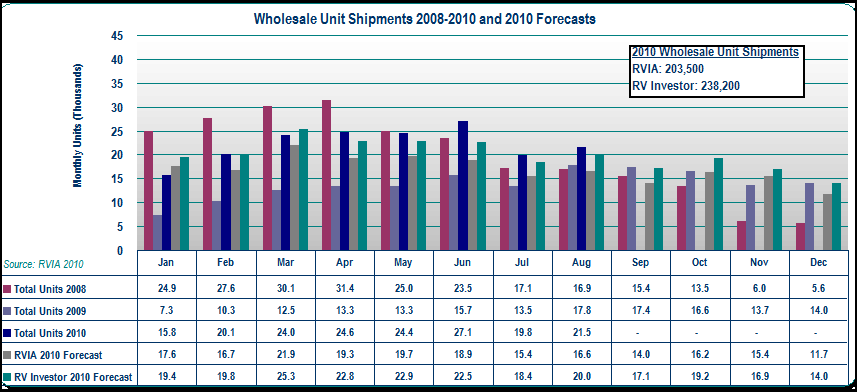
However, after four consecutive annual declines, industry trends are starting to show significant improvement, with wholesale unit shipments up more than 71% YoY so far in 2010.

While this torrid growth will slow, the higher end of 2010 forecasts show total annual wholesale shipments of 238.2k, a 44% increase.

RV Wholesale Unit Sales - 2008-2010 and Forecasts

2011 estimates expect a further increase in wholesale shipments to 256.9k units, an 8.2% increase from the projected 2010 total.

While the increase is impressive, a portion can be attributed to dealer’s re-stocking their inventory after cutting back significantly during 2008 and 2009.

On the retail front, the latest surveys show that retail sales of motorhomes increased 8.8% in May 2010, with towable sales up 10% in the same period.

Although there is a lag in new purchases vs. the requirement to purchase parts, this data is welcome sign for CRV, as the company is well positioned to take advantage of these trends as sales improve (for another cyclical play, check out Vicon Industries – VII).

Demographic Trends

The U.S. population is positioned for a large increase in the number of baby boomers that will be nearing retirement, the prime age for R/V purchases.

According to the RVIA, in 2010, the number of consumers aged 50 to 64 will be 57m, 38% higher than 2000 – one-in-ten consumers within this age group own at least one R/V.

Other factors such as the potential for higher fuel costs and more weekend getaways will also help spur the demand for R/Vs, as studies have shown that traveling by R/V is significantly less expensive than other forms of travel.

Both of these factors will combine for increased R/V purchases and greater demand for the corresponding parts.

Risks

While management has done a good job of paying down debt and reducing operating costs, CRV’s long-term efficiency averages are less than ideal.

5 year averages:

  • CROIC – 5.6%
  • ROE – 5%
  • ROA – 2.3%

Compare these numbers to Drew Industries (DW), the company’s closest competitor:

  • CROIC – 12.6%
  • ROE – 15.5%
  • ROA –10.4%

CRV’s cash flow has also been inconsistent over the past decade, falling into a ‘boom-bust’ cycle every 3-4 years.

So despite the very positive macro-trends, management must still prove they can capitalize on the opportunity.

Despite these risks, the company appears to be cheap on several measures.

Valuation

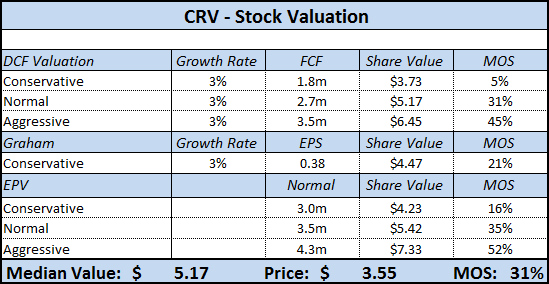
CRV Stock Valuation

The stock trades at less than half of book value and a 35% discount to NCAV – as a profitable company that is aggressively paying down debt and stockpiling cash, CRV appears to be undervalued at current levels.

Historically, the stock has traded with a P/B of 0.8 – applying this multiple to the current stock price, and the value would be $5.50, in-line with the above estimates.

Conclusion

Overall, Coastal Distribution System (CRV) is an interesting play on the strength and speed of the recovery in the R/V market.

According to the Recreation Vehicle Industry Association’s (RVIA), the summer/fall survey shows that:

“46 percent of RV owners are considering another purchase. Twenty-two percent said that they’re looking to buy in the next year, while 44 percent said within the next two years.”

Buoyed by strong demographic trends and a positive outlook for the industry, CRV has the potential to capitalize on this opportunity to grab market share and grow.

While I wouldn’t consider CRV for a long-term holding, the stock price should appreciate as the entire industry recovers, and could make for a strong investment, especially if the stock happens to fall under $3.

Disclosure

No positions.

iParty Corp. (IPT) operates 51 retail stores spread throughout New England and Florida. The company stocks over 20,000 products ranging from paper party goods and Halloween costumes to greeting cards and balloons.

The business is heavily dependent on holiday and party events like anniversaries and graduations, along with major holidays like Easter, Christmas, and Halloween.

Although the business is highly cyclical in nature during a given year, the company has been profitable for four out of the last 5 years (with the only hiccup being a loss in 2008 during the depths of the recession).

A string of recent insider buying and the upcoming Halloween season should help drive record profitability and free cash flow for this nano-cap stock.

Financials

Revenues have remained flat since 2006, falling into a range of $78-82M. Revenue increases are primarily driven from opening new stores – new store growth has slowed in the past few years as the company cut back during the recession.

5-yr median CROIC (11.4%) and ROE (5.1%) are unspectacular, but have risen substantially over the past several years. 2009 CROIC was 28.8% and it looks like 2010 will be in the same territory as well.

Debt to equity is high, at 148.4% in the most recent quarter – this number should come down after fourth quarter results. 2009’s debt to equity was 123.5%, down significantly from 243.9% in 2005.

IPT’s assets are tied up in inventory rather than cash or other liquid assets, and the company’s credit line is backed by this inventory. Hence, the quick ratio is very low, and the company’s Z-score could be improved.

While the balance sheet doesn’t compare to other stocks recently featured (JCTCF and APT for example), the company does have quite a bit of room left in its credit line, and has produced solid free cash flow each year since 2006.

On the income statement, management has done a great job of cutting costs so far in 2010 despite the flat sales. SGA expenses as a percentage of revenue was 36% in the second quarter of 2010, compared to an average of 45-50% in prior years.

Positives

Insider Buying

Five different insiders have been purchasing shares over the past year at prices ranging from $0.26-$0.30. In total, 346k shares were purchased, almost 1.5% of shares outstanding.

Several recent purchases in August and September should be a positive sign for the upcoming earnings release.

Increase in Comp Store Sales

After seven consecutive negative quarters for comp store sales, the company returned to growth for both the first (+1.3%) and second quarter (+1.4%) of 2010.

As a key metric for most retail businesses, this is a good sign going into IPT’s busiest time of the year, especially since 2009 was the best year in company history from both a net income and cash flow perspective.

Store Footprint

IPT opened its first city-based store in downtown Boston in December 2009. The company expects to open another store in a prime urban location before the 2010 Halloween season.

If management is correct, both should help drive increased exposure and sales for the fourth quarter.

In addition, the company has also increased its focus on temporary Halloween stores. It opened 4 temporary stores in 2009 compared to only 2 in 2008.

These temporary stores provide some flexibility to react to market trends, as the company can control its costs to some degree depending on the sales environment.

Negatives

Risk of Dilution

IPT currently has 5 different series of preferred shares, in addition to outstanding warrants for its common stock.

Combined, the preferred shares can be converted into approx. 15M shares of common stock, a significant number that could potentially lead to dilution for existing common shareholders.

The bulk of the warrants resulted from a 2006 financing agreement with Highbridge Capital – they carry an exercise price of $0.48/shr and currently expire in September 2011.

Cyclical Sales

IPT traditionally has reported a loss in its fiscal 1st quarter and 3rd quarter. The vast majority of profits come in the fourth quarter, with both the Halloween and Christmas holidays.

Other major events (such as the New England Patriots making it to the Super Bowl) can also have a dramatic effect on the company’s revenues. These fluctuations must be carefully managed and sometimes make investors nervous.

Although the company has done a great job in controlling SGA expenses, sales have stagnated around $78-80M.

There are only so many costs that can be wrung out of an organization, so top-line growth will have to come from somewhere (the urban-store expansion?) in order to propel the business further.

Valuation

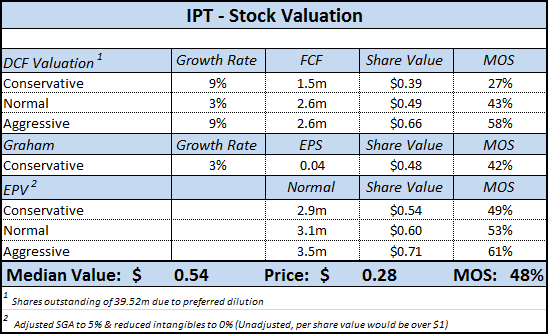
IPT - Stock Valuation

Assuming the company ends the year with $0.05 EPS, that translates into a P/E ratio of 5.6 at current prices.  Applying a normal P/E multiple of 10 leads to a price of $0.50, in line with the other valuation methods.

Conclusion

This year is shaping up to a stellar year and insiders have been extremely bullish going into historically the best quarter for the company.

Management has done a good job of controlling costs throughout the economic downturn and has resumed their store expansion strategy which should help drive sales growth (while keeping some flexibility with the temporary store locations).

The company is backed by top venture capital firms.

Robert H. Lessin, now the Vice Chairman of Jefferies & Co, owns approx 35% of the company and appears to be a rockstar in the angel industry on the East Coast, providing seed investments to Overture and Register.com.

Other current holdings by Roccia Partners, Highbridge International, Boston Millenia Partners, and Patriot Capital all provide positive reinforcement that the industry believes in the company.

Finally, another catalyst happens to occur in October 2010 – this month has five full weekends (5 Fridays, 5 Saturdays, & 5 Sundays).

The last time this occurred in October was 2004. It won’t happen again until 2021, but for a company like iParty that depends on Halloween, it should provide opportunity for shoppers to hit the stores, translating into a nice sales boost!

I’m adding IPT to the Value Uncovered portfolio at yesterday’s closing price of $0.28.

Disclosure

Long IPT